Indezine Logo


Animate Charts in PowerPoint 2013 for Windows

Learn how you can animate charts in PowerPoint 2013 for Windows. You can animate the entire chart or animate chart categories or series sequentially.


Author:

Product/Version: PowerPoint 2013 for Windows

OS: Microsoft Windows 7 and higher


Learn PowerPoint

Learn how to turn off Animation Preview in PowerPoint.


We have already explored how you can animate any slide object, and then tweak the animation speed and animation events. Although you add animation to a chart in the same way as you animate any other object, PowerPoint provides some extra animation options that are applicable only to charts. For example, you can animate series and categories individually as required. If your example chart is a column chart, then you can individually control the animation of every single column! Additionally, you can also decide whether you want to animate the Plot Area or not. In this tutorial, we'll explore how to apply animation to charts, and also explore the various chart animation options available in PowerPoint 2013 for Windows.

Animating Text and SmartArt in PowerPoint

Like charts, there are extra animation options available for bulleted text and SmartArt.

So, why would you want to animate a chart? Here are some reasons:

  • You might want to highlight an individual chart series or category over others, and animation lets you highlight that part of the chart.
  • You want to animate the Plot Area separately from the rest of the chart.
  • You want to animate all the columns or bars in a chart to rise up (or down, left, or right) one at a time—either automatically or sequenced. Similarly, for a pie chart or a line chart, you may want individual pies and line elements to animate respectively.

Those were just the most common reasons why you would want to animate a chart. There are plenty of other reasons you will discover for yourself! Also remember that animation is movement, and that's something that will attract attention. For that reason, only animate charts that you want to focus on. Animating every single chart in your presentation may be taking the movement approach too far!

Sample Presentation with Chart Animation

Scroll down to the bottom of this page to see a sample presentation showing animated charts.

Follow these steps to apply animation to a chart. In this tutorial, we'll use a common column chart, but the concepts remain the same with other chart types:
  1. Open a slide that already has a chart. Alternatively, insert a chart on the PowerPoint slide.
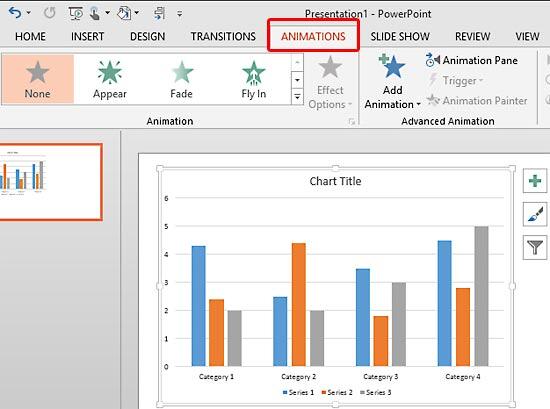
  2. Then, access the Animations tab of the Ribbon, as shown highlighted in red within Figure 1, below.
  3. Chart inserted on PowerPoint slide
    Figure 1: Chart inserted on PowerPoint slide
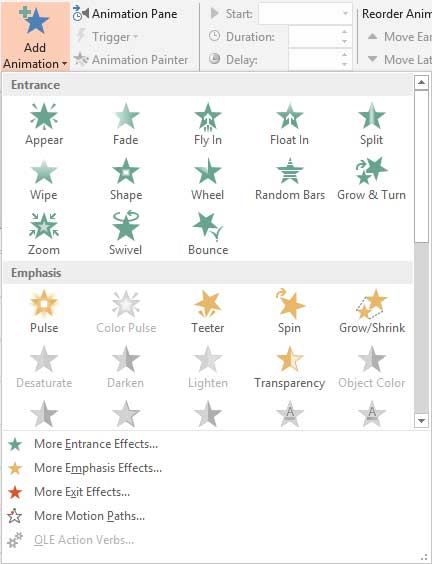
  4. Make sure that the entire chart is still selected rather than a single chart element. To achieve this objective, click on the edge of the chart. This step ensures that the entire chart is selected, as shown in Figure 1, above. Now, click the Add Animation button to bring up the Add Animation drop-down gallery, as shown in Figure 2, below.
  5. Add Animation drop-down gallery
    Figure 2: Add Animation drop-down gallery
  6. Within the Add Animation drop-down gallery, you can select any of the four animation types that PowerPoint supports. For this tutorial, we chose the Wipe Entrance animation effect.
  7. By default, PowerPoint will animate the whole chart as one object. To animate individual chart elements, you need to first make the Animation Pane visible. To do so, click the Animation Pane button, as shown highlighted in red within Figure 3, below, within the Animations tab of the Ribbon.
  8. Animation Pane button
    Figure 3: Animation Pane button
  9. Animation Pane Toggle Option

    The Animation Pane button is a toggle option. So, if your Animation Pane is already visible, then clicking this button will make the pane disappear. Click again to make it appear again.
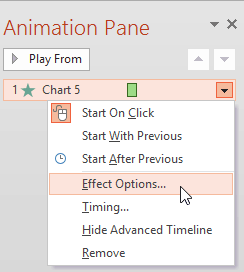
  10. Within the Animation Pane, right-click the animation applied to your chart. Doing so will bring up a drop-down list, as shown in Figure 4, below. Within this drop-down list, choose Effect Options as shown in Figure 4. Alternatively, double-click the animation within the Animation Pane.
  11. Effect Options to be selected for the animation
    Figure 4: Effect Options to be selected for the animation
  12. Either way, you summon a multi-tabbed dialog box, as shown in Figure 5, below. Click the Chart Animation tab, and from the Group chart drop-down list, choose any of the available options:
  13. As One Object: Animated all at once.
    By Series: All Series are animated one by one.
    By Category: All categories are animated one by one.
    By Element in Series: All individual series elements are animated sequentially.
    By Element in Category: All individual category elements are animated sequentially.
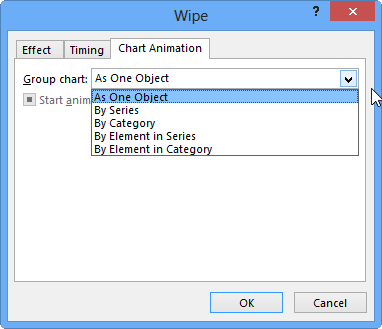
  14. Chart Animation options
    Figure 5: Chart Animation options
  15. All Animations are Not Equal for Charts

  16. Cannot find all the options shown above in the Chart Animation tab? The options you see depend upon the animation effect you apply. The Wipe animation effect provides the maximum amount of options.
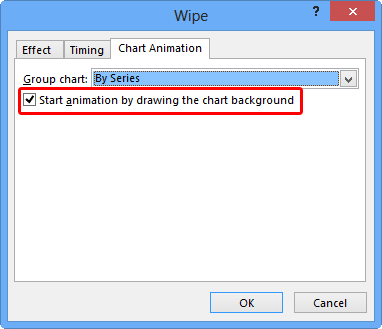
  17. Notice the Start animation by drawing the chart background check-box, as shown highlighted in red within Figure 6, below. Choose this option to begin the animation sequence by drawing the chart background including the plot area on the slide. Click OK to apply.
  18. Start animation by drawing the chart background
    Figure 6: Start animation by drawing the chart background
  19. Save your presentation.

Chart Animation Limitations

There are no built-in options to animate legends, data labels, or axes separately in PowerPoint. You can only animate categories and series, and the plot area individually.

Sample Presentation

Click below to view on YouTube


See Also:

13 04 03 - Animate Slide Objects: Animate Charts in PowerPoint (Glossary Page)

Animate Charts in PowerPoint 2011 for Mac
Animate Charts in PowerPoint 2010 for Windows
Animate Charts in PowerPoint 2007 for Windows

You May Also Like: The Power of Story in Speaking | Ears PowerPoint Templates


Popular Posts

Shapes
Shapes
Learn how you can create and manipulate shapes in PowerPoint -- knowledge of working with shapes is significant because they are the building blocks of creativity in PowerPoint.

Insert Picture from the Office ClipArt Collection in PowerPoint 2013
Learn how to insert picture using Office ClipArt in PowerPoint 2013.

Snow Effect in PowerPoint
Create a snow fall effect inside PowerPoint using animation techniques.

PowerPoint Transitions: Curtains
Explore the Curtains transition effect in PowerPoint.


Polygon Center Circles for PowerPoint

These special circles have polygon centers: the centers are made of triangles, squares, pentagons, and hexagons! And based on the sides of the polygon, the rest of the circle has that many segments.

Download and use these Polygon Center Circles in your slides for just $4.99


Microsoft and the Office logo are trademarks or registered trademarks of Microsoft Corporation in the United States and/or other countries.

Home | PowerPoint | Photoshop | PowerPoint Templates | PowerPoint Tutorials | Blog | Notes | Ezine | Media Kit | Feedback | Site Map | About Us | Contact Us

Link to Us | Privacy | Testimonials

PowerPoint Backgrounds | Christian PowerPoint Backgrounds | Business PowerPoint Presentation Templates

Plagiarism will be detected by Copyscape

©2000-2023, . All rights reserved.