Indezine Logo


Apply Fills to Plot Area of Charts in PowerPoint 2011 for Mac

Learn to apply fills to the Plot Area of a chart in PowerPoint 2011 for Mac. Such filled-up Plot Areas may sometime work for simple charts, but not always for complicated charts.


Author:

Product/Version: PowerPoint 2011 for Mac

OS: Mac OS X


Learn PowerPoint

Warning: This presentation cannot de edited because it contains a read-only embedded font


The Plot Area for a chart is the layer or a backdrop upon which the chart itself is placed. This layer has axes on its perimeter and also, the Data Series and Gridlines are placed above this layer. By default, the Plot Area has no fill attributes, and thus it shows the slide's background. This may look plain, and that by itself is no reason to change the fill of the Plot Area. However, there are times when the slide background itself is busy, and adding a different fill to the Plot Area can then make the chart appear more clear.

There are various fills you can apply to the Plot Area, such as a solid color, a gradient, a picture/texture, or a pattern as shown in Figure 1, below.
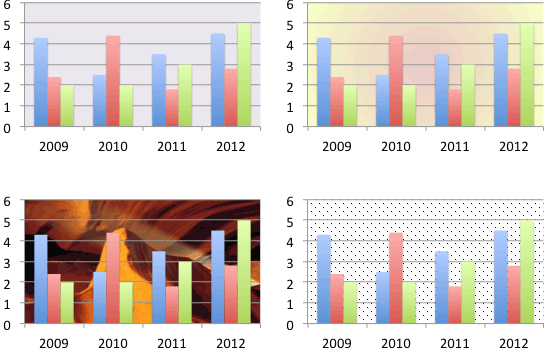
Variants of the same chart with solid color, gradient, picture, and pattern fills applied to the Plot Area
Figure 1: Variants of the same chart with solid color, gradient, picture, and pattern fills applied to the Plot Area

Follow these steps to learn how to change the fill of a chart's Plot Area in PowerPoint 2011 for Mac:
  1. Select the chart that you want to format the Plot Area for. If you don't have a chart, insert a new chart.
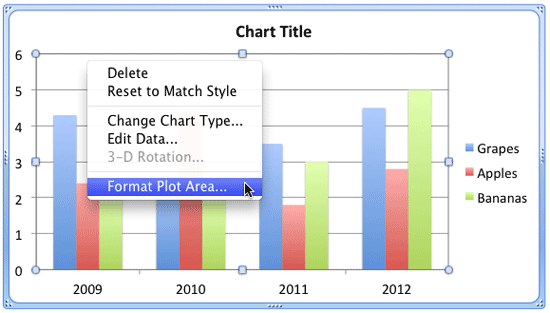
  2. Now, carefully right-click (or Ctrl+click) the Plot Area. From the resultant menu, select the Format Plot Area option, as shown in Figure 2, below.
  3. Format Plot Area option
    Figure 2: Format Plot Area option
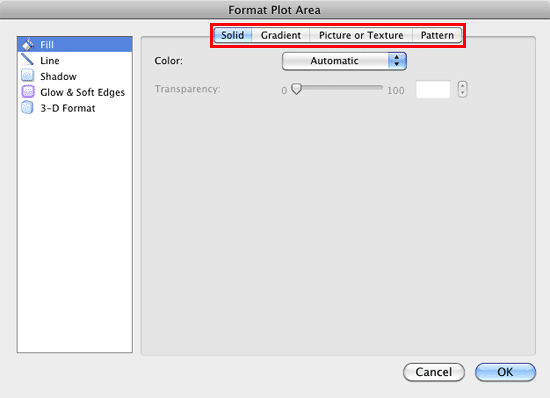
  4. Doing so summons the Format Plot Area dialog box, as shown in Figure 3, below. Make sure that the Fill option is selected within the sidebar, as shown in Figure 3, below.
  5. Format Plot Area dialog box
    Figure 3: Format Plot Area dialog box
  6. Within the Format Plot Area dialog box, you can see various tabs representing Fill options for the Plot Area, highlighted in red within Figure 3, below. Let us explore each of them. For more information on each of these options, refer to the tutorials linked:
  7. Solid

  8. This option is used to fill the Plot Area with a solid color. To learn more about this option, refer to our Apply Solid Fills to Plot Area in PowerPoint 2011 for Mac tutorial.
  9. Gradient

  10. Fills the Plot Area with a gradient fill. To learn more about this option, refer to our Apply Gradient Fills to Plot Area in PowerPoint 2011 for Mac tutorial.
  11. Picture or Texture

  12. A picture or a texture can be used as a fill for the Plot Area using this option. Learn more about this option in our Apply Picture Fills to Plot Area in PowerPoint 2011 for Mac and Apply Texture Fills to Plot Area in PowerPoint 2011 for Mac tutorials.
  13. Pattern

  14. You can also use one of 48 patterns offered by PowerPoint as a fill for Plot Area. To get more info, refer to our Apply Pattern Fills to Plot Area in PowerPoint 2011 for Mac tutorial.
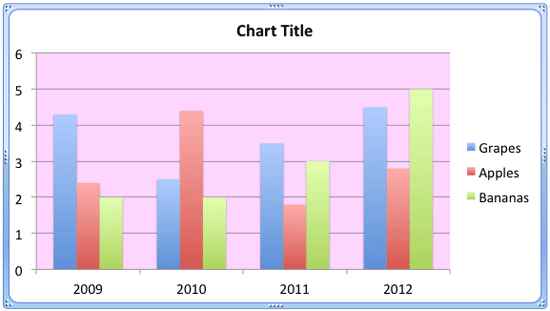
  15. Select the required option and format the Plot Area as required. In Figure 4, you can see that the Plot Area of our sample chart is filled with pink (compare with partially visible chart in Figure 2, shown on this page previously).
  16. Plot Area
    Figure 4: Plot Area with a solid fill
  17. Save your presentation often.

See Also:

Plot Area: Apply Fills to Plot Area (Glossary Page)

Apply Fills to Plot Area in PowerPoint 2013 for Windows

You May Also Like: Ten Easy Topics for Pecha Kucha | Wave PowerPoint Templates


Popular Posts

Set Minimum and Maximum Values on Value Axis in PowerPoint 2013 for Windows
Learn how to set the Minimum and Maximum values on Value Axis of Charts in PowerPoint 2013 for Windows.

Crop Pictures (Mask to Shape) in PowerPoint 2011 for Mac
Learn how to crop pictures using Mask to Shape option in PowerPoint 2011 for Mac.

Playing Video Across Slides in PowerPoint 2016 for Windows
Play a video clip across slides in PowerPoint 2016 for Windows.

Set Document Resolution in PowerPoint 2016 for Windows
Learn how to set document resolution in PowerPoint 2016 for Windows.


Polygon Center Circles for PowerPoint

These special circles have polygon centers: the centers are made of triangles, squares, pentagons, and hexagons! And based on the sides of the polygon, the rest of the circle has that many segments.

Download and use these Polygon Center Circles in your slides for just $4.99


Microsoft and the Office logo are trademarks or registered trademarks of Microsoft Corporation in the United States and/or other countries.

Home | PowerPoint | Photoshop | PowerPoint Templates | PowerPoint Tutorials | Blog | Notes | Ezine | Media Kit | Feedback | Site Map | About Us | Contact Us

Link to Us | Privacy | Testimonials

PowerPoint Backgrounds | Christian PowerPoint Backgrounds | Business PowerPoint Presentation Templates

Plagiarism will be detected by Copyscape

©2000-2023, . All rights reserved.