Typically, the Plot Area sports no fill attributes, and thus shows the slide's background. You can apply any fill to your chart's Plot Area. The reason why you would like to do that is to highlight the Data Series and Gridlines that populate your chart's Plot Area, especially if you have a busy slide background. In this tutorial, let us learn how to apply a solid fill to the chart's Plot Area in PowerPoint 2013 for Windows.
Follow these steps to explore more in PowerPoint 2013 for Windows:
- Select the chart that you want to format the Plot Area for. If you don't have an existing chart, insert a new chart in your slide.
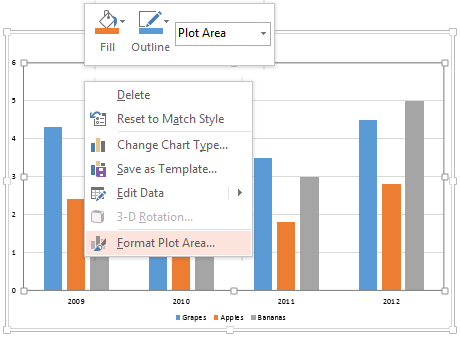
- Now, carefully right-click the Plot Area to bring up a contextual menu as shown in Figure 1. In this contextual menu, select the Format Plot Area option (refer to Figure 1 again). If you do not get the Format Plot Area option in the contextual menu, you may have right-clicked on another chart element. Make sure you then deselect anything in the chart, and then right-click on the edge of the Plot Area.

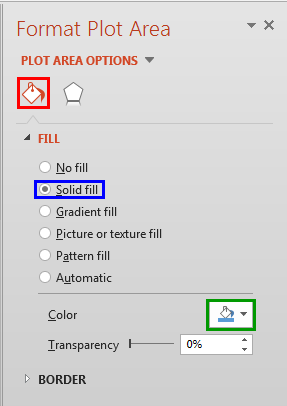
Figure 1: Format Plot Area option - Doing so opens the Format Plot Area Task Pane, as shown in Figure 2. In this Task Pane, click the Fill & Line button, highlighted in red within Figure 2 and click the Solid fill radio button (highlighted in blue within Figure 2). Then, click the Color button (highlighted in green within Figure 2).

Figure 2: Solid fill option selected - Doing so opens the Color drop-down gallery, as shown in Figure 3.

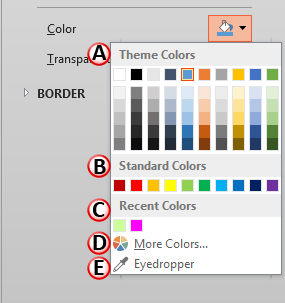
Figure 3: Color drop-down gallery - The options within the Color drop-down gallery are explained below, as marked in Figure 3, above. You'll need to choose any one of these options to apply solid fills to the Plot Area:
A. Theme Colors
- Here you can select any of the colors which are from the active Theme of the presentation. You can also select any of the 5 tints or shades for any Theme color. Learn more about Themes here.
B. Standard Colors
- Here you can choose from any of the ten standard colors. These ten standard colors are just choices of colors that PowerPoint believes to be widely used. You don't have to limit yourself to either the Theme colors or Standard colors, as you'll learn in the next options. It's a good design idea to use Theme colors as far as possible.
C. Recent Colors
- Here you can find the colors most recently used. If you have just launched PowerPoint and created a new presentation, the Recent Colors option may be entirely absent since you haven't selected any color recently!
D. More Colors
- This option is to summon the Colors dialog box as shown in Figure 4. This dialog box has two tabs: Standard and Custom. First select the Standard tab (again, refer to Figure 4).

Figure 4: Standard tab within the Colors dialog box - The Standard tab offers 127 colors in a honeycomb style palette, including 14 gray shades, black and white. You can even change the transparency value of the selected color in the Transparency slider below. If you want more color choices, then select the Custom tab of the same dialog box, as shown in Figure 5.

Figure 5: Custom tab within the Colors dialog box - Within the Custom tab, you can choose any color from the spectrum and later adjust the selected color's luminosity with the slider on the right. You can even enter specific values of RGB and HSL to create a specific color. All these combinations provide 16 million color choices!
- Again, you can even change the transparency value of the selected color in the Transparency slider below.
- Choose any color and click the OK button to apply it.
E. Eyedropper
- This new option in PowerPoint 2013 enables you to pick an exact color from anywhere, sometimes even from somewhere outside PowerPoint. Explore our Eyedropper Option in PowerPoint 2013 tutorial to learn more.
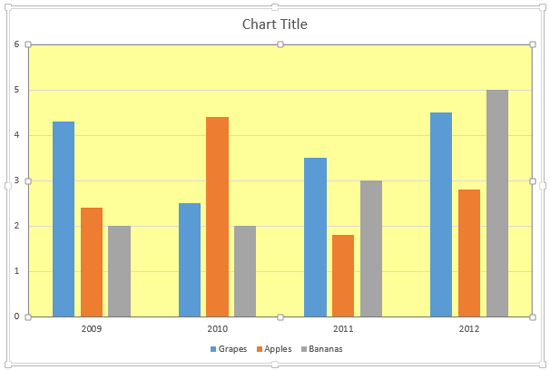
- Select the required options and format the fill of the Plot Area as required. In Figure 6, you can see that the Plot Area of our sample chart is filled with yellow (compare with partially visible chart in Figure 1, shown earlier on this page).

Figure 6: Plot Area applied with a solid fill color - Save your presentation often.


