There are various fills that you can apply to the Plot Area of a chart, and a texture can often work surprisingly well. For those who want to know what a texture is, it's essentially a picture that tiles across an area. We have explored other fills for chart Plot Areas such as a solid color, a gradient, a picture, or a pattern.
In this tutorial, we will explore texture fills for a chart's Plot Area in PowerPoint 2011 for Mac:
- Select the chart that you want to format the Plot Area for. If you don't have a chart, insert a new chart.
- Now, carefully right-click (or Ctrl+click) the Plot Area. From the resultant menu, select the Format Plot Area option, as shown in Figure 1, below.
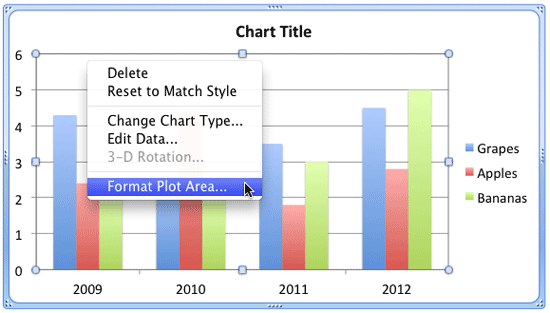
Figure 1: Format Plot Area option - Doing so summons the Format Plot Area dialog box, as shown in Figure 2, below. Make sure that the Fill option is selected within the sidebar, highlighted in red within Figure 2. Then, select the Picture or Texture tab, highlighted in blue within Figure 2. Within this tab, click the Choose Texture option, highlighted in green within Figure 2.
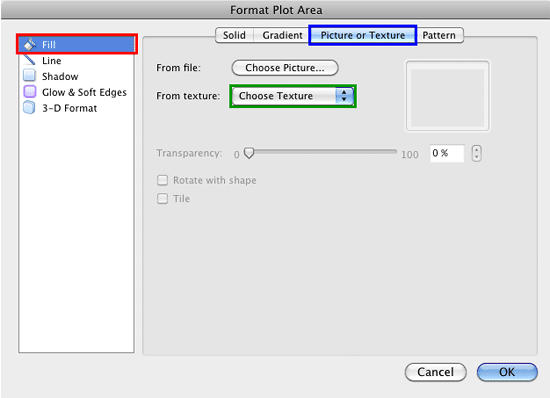
Figure 2: Picture or Texture tab within the Format Plot Area dialog box - This step will bring up the Textures gallery, as shown in Figure 3, below. In this gallery, you will find 24 different textures which you can choose from. Use the arrow button at the bottom of the gallery, highlighted in red within Figure 3. To explore more texture previews.
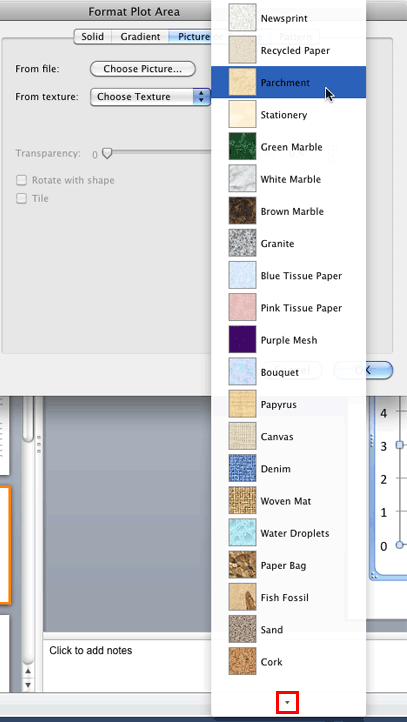
Figure 3: Textures gallery within the Format Plot Area dialog box - Click on a texture to apply as a fill. This action will take you back to the Format Plot Area dialog box, where you can now see the selected texture in the preview area, as shown in Figure 4, below.
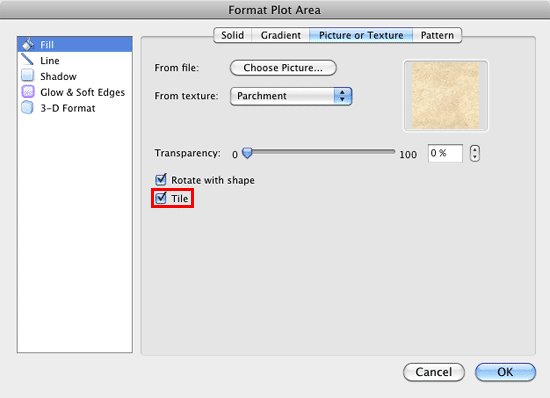
Figure 4: Texture fill chosen for the Plot Area Fill - At this point, you can make some more changes to the texture fill using the other options in the Format Plot Area dialog box as explained below:
- If you want to change the transparency of the texture fill, you can use the Transparency slider that you can see in Figure 4, above.
- When you use the texture as a fill, the Tile check-box will be selected by default, as shown highlighted in red within Figure 4, above. You can deselect it if you want. Taking this option further, you can also add your own picture as a fill, and then check the Tile option to use that picture as a tiled texture.
Why Cannot I Rotate the Plot Area?
- Even though the Rotate with shape check-box is available for selection within the Format Plot Area dialog box, selecting/deselecting it won't make any difference to the texture fill. This is because you can't rotate the Plot Area.
- Once you have made all required selections in the Format Plot Area dialog box, click the OK button to get back to the slide where you can see the selected Plot Area filled with selected texture, as shown in Figure 5, below.
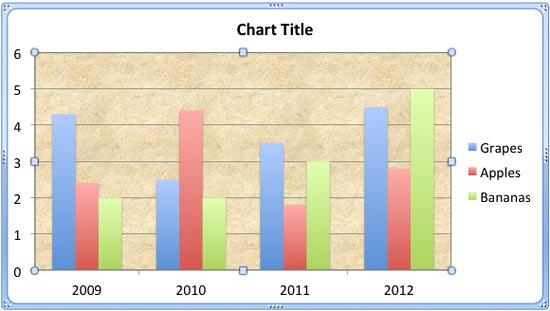
Figure 5: Plot Area applied with a texture fill - Save your presentation often.


