Learn about chart axes in PowerPoint. We also look at various elements of a chart axis.
Author: Geetesh Bajaj
Product/Version: PowerPoint
OS: Microsoft Windows and Mac OS X
The axis is the measuring scale that is typically placed towards the left and bottom of your chart. Typically, there are two axes:
Both these axes can be seen marked in Figure 1, below.
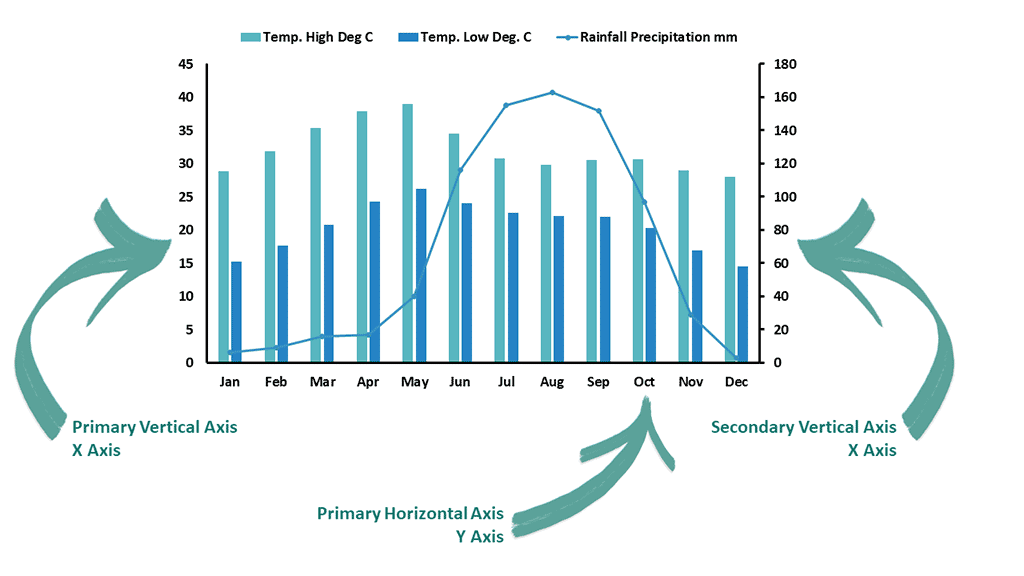
Figure 1: Axes of a chart in PowerPoint
Two more axes can be placed for most chart types. These would be:
The secondary vertical axis can be seen in Figure 1, above. The secondary horizontal axis is less commonly used, and is not shown in Figure 1.
Some common terminology is used to call out these axes, as explained below:
Look at Figure 2, below, where you have a typical column chart. You will see that there are only two axes available for this chart. There's one each of the horizontal and vertical axes.
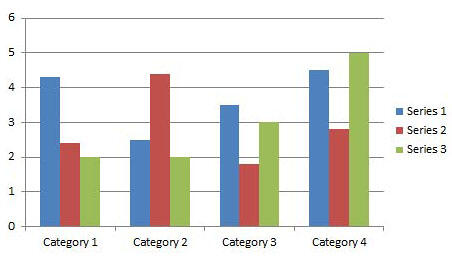
Figure 2: X and Y axes in a Column chart
Axes are available in most chart types. Some types, such as Pie charts and Doughnut charts have no axes.
To confirm how many axes your chart uses, select your chart and access the Chart Tools Layout tab of the Ribbon (Mac versions of PowerPoint call this the Chart Layout tab). Here, click the Axes button to bring up a menu, as shown in Figure 3, below. Note that two axes are displayed within this menu, as shown in Figure 3.
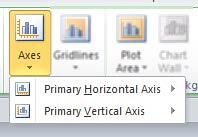
Figure 3: Axes menu displaying two axes
The Chart Tools Layout tab is a Contextual tab. Contextual tabs are special tabs in the Ribbon that are not visible all the time. They only make an appearance when you are working with a particular slide object which can be edited using special options.
Now, look at Figure 4, below, where we added an extra Y or secondary vertical axis placed towards the right side of the chart's Plot Area.
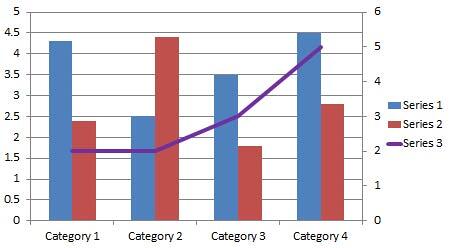
Figure 4: Extra Y or secondary vertical axis added
Now, access the Chart Tools Layout tab and click the Axes button. Sure enough, you will now see four axes displayed on this menu, as shown in Figure 5, below (compare with Figure 3, shown previously on this page).

Figure 5: Axes menu displaying four axes
Note that both the horizontal and vertical axes always show up in pairs within the Axes menu. You will see both secondary axes even if you have just one visible on your chart.
Next, look at this 3D Column chart, as shown in Figure 6, below, that has a third axis in addition to the two primary axes. This third axis is not a secondary axis but a Depth axis, which is also known as Z axis or a Series axis. Depth axes typically add a third dimension in 3D charts.
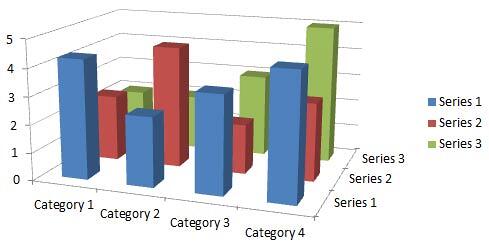
Figure 6: Depth axis in a 3D Column chart
Again, when you access the Chart Tools Layout tab of the Ribbon, and click the Axes button, you will see three axes displayed on the resultant menu, as shown in Figure 7, below. Notice that the Depth Axis is now shown.
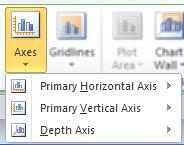
Figure 7: Depth axis within the Axes menu
Now that we have explored the different axis types available for PowerPoint charts, let us look at various elements of axes which are explained below as marked in Figure 8, below.
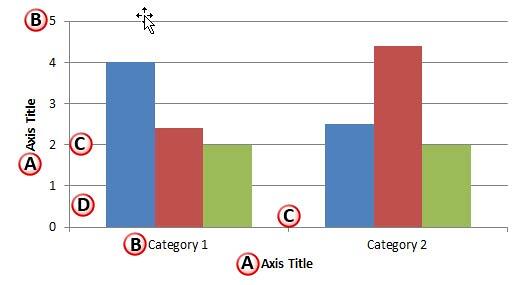
Figure 8: Main elements of X and Y axes
The main elements of X and Y axes are:
Most axes do not display their titles but you can add a title and also change its location. By default, the name of your axis title may show up as Axis Title, as shown in Figure 8, above. Select the text box for the axis title, and type something else to replace the text to something more descriptive and suitable. Learn more about axis titles here.
These are labels for various categories on the horizontal (category axis). On the vertical (values) axis, the labels are the values. These are typically numbers or percentage values. Learn more about changing labels, and repositioning or hiding axis labels here.
Major tick marks are the indications on an axis that show up between categories on the horizontal axis, and besides Major Unit values on the vertical axis. Learn more about Tick Marks here.
This is the value interval in the vertical axis. In our example chart shown in Figure 8, above, the Major Unit is set to 1. Learn more about changing the Major Unit of the value axis here.
10 08 01 - Chart Axes: Axes in PowerPoint (Glossary Page)
You May Also Like: First Impressions Last, by Jerry Weissman | Passion Flower PowerPoint Templates


Microsoft and the Office logo are trademarks or registered trademarks of Microsoft Corporation in the United States and/or other countries.