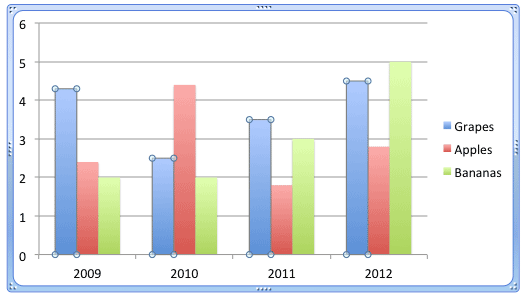
You may have created the perfect chart, but what if you need to change the order of your data series? What if you have to reverse their sequence, or even swap the position of some series? Let's say your data series are grapes, apples, and bananas—and these show up in exactly the same order, as shown in Figure 1, below.

Figure 1: Data series selected in the chart
Now, what if you want to change this order to grapes, bananas, and apples? Yes, you can make these changes in the Excel sheet that contains the data for your PowerPoint chart, but is there an easier way? Indeed, there is!
To start with, you need to select your chart. Then, follow these steps to learn more in PowerPoint 2011 for Mac.
- Click on any data series to select it. In Figure 1, above, you can see that the entire grapes series has been selected.
- With the data series selected, access either the Chart Layout or the Format tabs of the Ribbon. Both these tabs contain the Current Selection group that you can see in Figure 2 towards the extreme left. Within this group, the Chart Elements selection box is shown highlighted in red within Figure 2, below. This selection box shows the name of the selected chart element. Make sure the series is still selected. Then, click the Format Selection button, highlighted in blue within Figure 2.

Figure 2: Format Selection button - Alternatively, right-click (or Ctrl + click) the selected series and from the contextual menu, select the Format Data Series option.
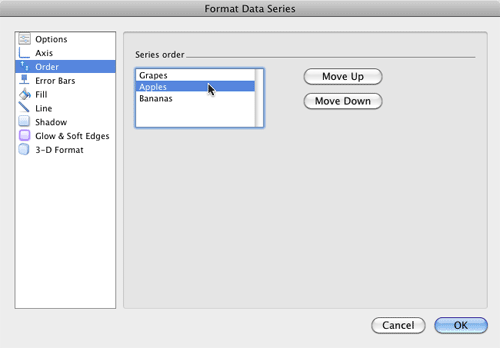
- Either of the above options will summon the Format Data Series dialog box. Select the Order option within the sidebar as shown highlighted in red within Figure 3, below. Within the dialog box, you can see all Data Series listed as shown highlighted in blue within Figure 3, in the same order as they appear in the selected chart. Also, notice that in Figure 3, the Move Up button is grayed out. This is because the grapes data series we have selected is in the first position, so it can't be moved up further.

Figure 3: List of data series within Format Data Series dialog box - Within the data series list, click on the series that you want to change the order of. In Figure 4, below, you can see that we have selected the second data series named Apples. You can also see that the Move Up button is now active, since the selected data series is in the middle position and it can be moved up or down.

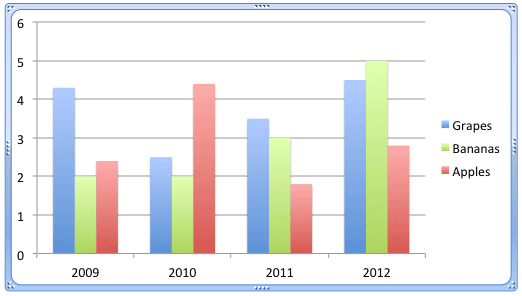
Figure 4: Select the required data series - If you want to move the selected data series to an earlier position, then click the Move Up button. If you want to move it towards the end, click the Move Down button. As and when you click these buttons, you can see the changes happening in the selected chart simultaneously. In Figure 5 you can see that we have moved the Apples series to the end.

Figure 5: Selected Data Series moved downwards - Once you have reordered the data series as required, click the OK button within the Format Data Series dialog box. In Figure 6 you can see that the Apples series has been moved to the end (compare to Figure 1)

Figure 6: Data Series reordered - Save your presentation often.


