Change major and minor units of the value axis in PowerPoint 2003 and 2002 for Windows. We also explore other value axis options.
Author: Geetesh Bajaj
Product/Version: PowerPoint 2003 and 2002 for Windows
OS: Microsoft Windows XP and higher
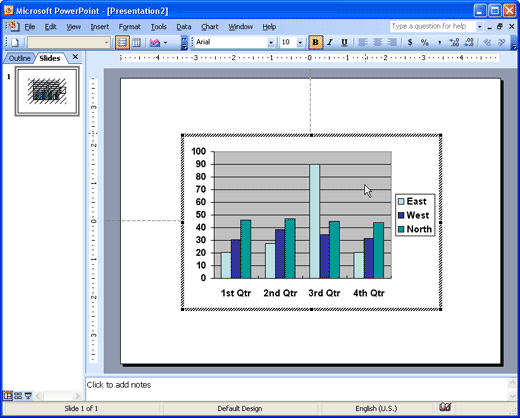
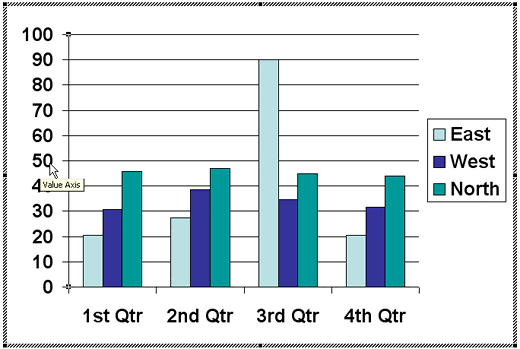
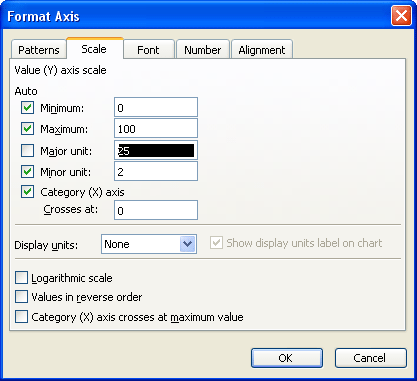
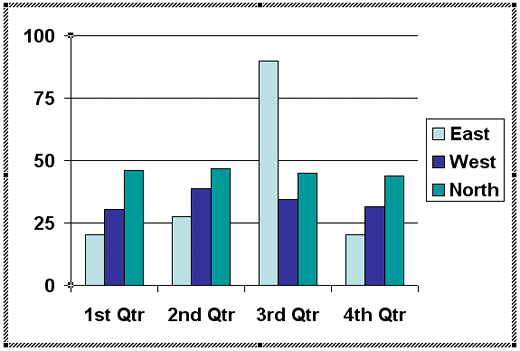
Working with charts in PowerPoint involves a deep knowledge because hidden beneath the surface are umpteen options that many PowerPoint users are simply not aware of. Through these series of chart tutorials, we have already taught you how you can change chart types or change fills and outlines for chart data series. You also learned how you can play with fonts and other text options of charts, and yet, these ideas are just the tip of the iceberg. One of my pet peeves is how PowerPoint adds so many major units to the Y axis by default. To see this visually, look at Figure 1, below and you will see major units added at 10 point increments. To make the axis less crowded, we would have preferred setting them at 25 point increments.
o follow along with this tutorial, you need a slide with the default column chart inserted in PowerPoint 2003 or 2002.
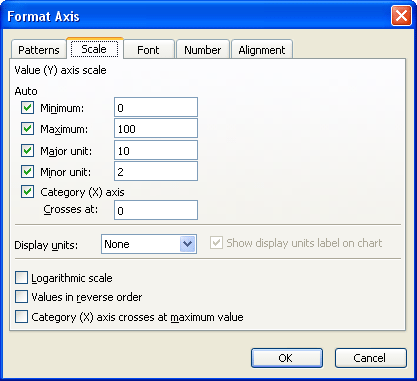
Follow these steps to change major unit of the Y axis in PowerPoint 2003 and 2002 for Windows:
10 08 05 - Chart Axes: Change Major and Minor Units of Value Axis (Glossary Page)
Change Major and Minor Units of Value Axis in PowerPoint 2013 for Windows
Change Major and Minor Units of Value Axis in PowerPoint 2011 for Mac
Change Major and Minor Units of Value Axis in PowerPoint 2010 for Windows
Change Major and Minor Units of Value Axis in PowerPoint 2007 for Windows
You May Also Like: The Power of Story in Speaking | Light Bulb PowerPoint Templates


Microsoft and the Office logo are trademarks or registered trademarks of Microsoft Corporation in the United States and/or other countries.