Indezine Logo


Chart Area: Font Options in PowerPoint 2011 for Mac

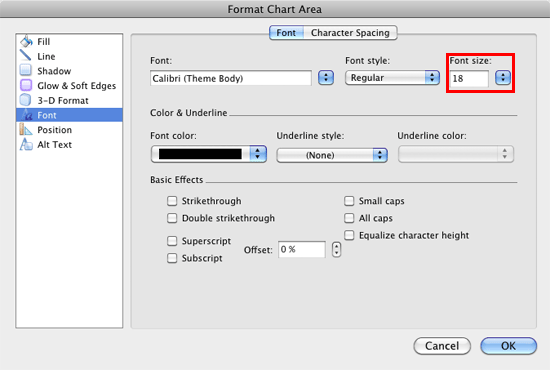
Learn how to format text within the Chart Area in PowerPoint 2011 for Mac.


Author:

Product/Version: PowerPoint 2011 for Mac

OS: Mac OS X


By default, text used within a chart is not really formatted and looks very simple as shown in Figure 1 below. Note that the font style used is derived from the information available within the Theme or template used for the slides. Now you really should not change the text formats within your chart unless you have a compelling reason to do so because there's no reason to make appearances inconsistent just because PowerPoint allows you to do so!

Chart Area
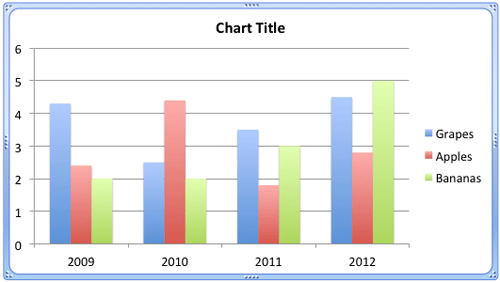
Figure 1: Chart Area

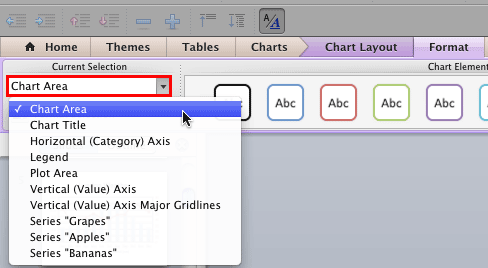
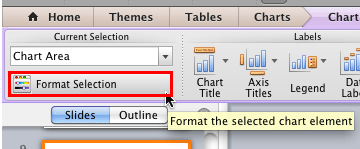
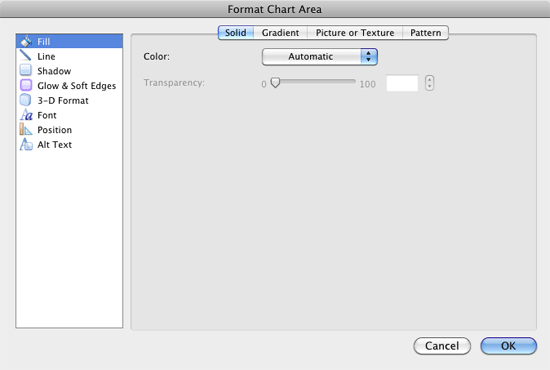
Even though this default format looks consistent, at times you may want to change the text format. Follow these steps to explore more:

  1. Select the chart that you want to format the Chart Area for in PowerPoint 2011. If you don't have a chart, insert a chart, you can also change the chart type from one to another.
  2. Now, select either the Chart Layout or the Format tab of the Ribbon. Both of these tabs contain the Current Selection group that you can see in Figure 2 towards the extreme left. Within this group, you can see the Chart Elements selection box (highlighted in red within Figure 2). This selection box contains a list of chart elements in the selected chart. Within this list, click on the Chart Area option, now you can see a tick mark prefixed to this option, as shown in Figure 2 to indicate its selected status.

    Chart Area selected
    Figure 2: Chart Area selected

    Below this Current Selection list is the Format Selection button, as shown highlighted in red within Figure 3. Click this button.

    Format Selection button
    Figure 3: Format Selection button

    Alternatively, carefully right-click (or Ctrl+click) the Chart Area (click close to the edge of your chart), from the contextual menu that appears, select the Format Chart Area option as shown in Figure 4.

    Format Chart Area option
    Figure 4: Format Chart Area option
  3. This summons the Format Chart Area dialog box as shown in Figure 5.

    Format Chart Area dialog box
    Figure 5: Format Chart Area dialog box

    In this dialog box, you can see various options (within the sidebar) that help you to format the Chart Area. The top five options, Fill, Line, Shadow, Glow & Soft Edges, and 3-D Format are used to format the appearance of the Chart Area. These options have already been explained in our Fill and Line Options for the Chart Area in PowerPoint 2011 for Mac tutorial.

    Select the Font option within the sidebar to access the font editing options for the entire chart as shown in Figure 6.

    Font option within the Format Chart Area dialog box
    Figure 6: Font option within the Format Chart Area dialog box

    Here, within the Font tab, you will find the options to set the Font, Font style, Font color etc. for the chart text. To learn more about how to use these options, refer to our Font Options Within the Format Text Dialog in PowerPoint 2011 for Mac tutorial.

    Note: Even though you can use all options within Font tab, it is not a good idea to change the Font size (highlighted in red within Figure 6) since it will make all chart text to be of same size. You would definitely not want the Chart Title and Axis Labels to be of same size.
    To learn about the options within Character Spacing tab, refer to our Character Spacing in PowerPoint 2011 for Mac tutorial.
  4. Select the required options and format the chart text as required. Click OK button to apply the settings and get back to your slide. Figure 7 shows our sample chart with formatted text (compare Figures 1 and 7).

    Format Chart Area dialog box
    Figure 7: Format Chart Area dialog box
  5. Save your presentation often.

Jigsaw Graphics for PowerPoint

Here are 10 jigsaw graphics containing different shapes. These graphics are available in both black and white and are contained within separate sample presentations that you download. Additionally, these jigsaw graphics are vector shapes, so you can easily edit them within your Microsoft Office program by changing fills, lines, and effects or even applying Shape Styles.

Download and use these Jigsaw Graphics in your slides for just $4.99+


Microsoft and the Office logo are trademarks or registered trademarks of Microsoft Corporation in the United States and/or other countries.

Home | PowerPoint | Photoshop | PowerPoint Templates | PowerPoint Tutorials | Blog | Notes | Ezine | Media Kit | Feedback | Site Map | About Us | Contact Us

Link to Us | Privacy | Testimonials

PowerPoint Backgrounds | Christian PowerPoint Backgrounds | Business PowerPoint Presentation Templates

Plagiarism will be detected by Copyscape

©2000-2023, . All rights reserved.