Learn about the Chart Area in PowerPoint 2011 for Mac. Above the Chart Area are all other chart elements.
Author: Geetesh Bajaj
Product/Version: PowerPoint 2011 for Mac
OS: Mac OS X
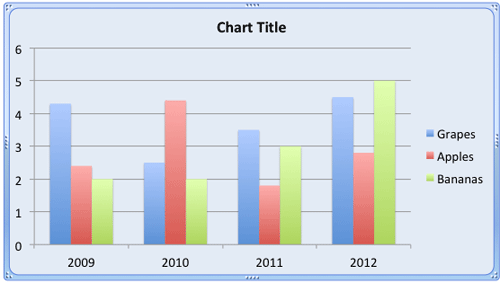
The Chart Area is essentially the entire area that encompasses your chart. Everything on the chart is placed atop this area. Thus, you can say that the Chart Area is that part of your chart that's placed below all other chart elements. Look at Figure 1 below, where you can see the Chart Area colored in pale blue, which is surrounded by selection handles.

Figure 1: Chart Area
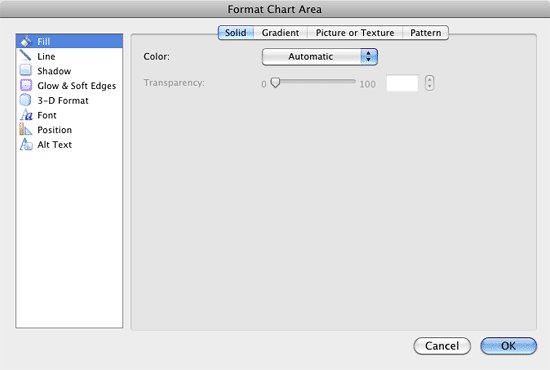
By default, the Chart Area doesn't show any fill or any formatting unless you have used a particular Chart Style. Even though this default status works well, you can opt to format as required. You can change the appearance of the Chart Area, or make the entire chart text use a single font attribute, or change the position of the chart on the slide with just a few clicks.
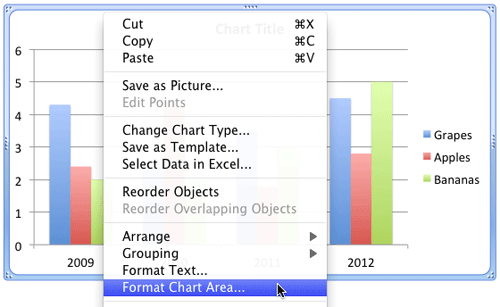
Follow these steps to explore more about Chart in PowerPoint 2011 for Mac:


See Also:
Chart Area: Chart Area (Glossary Page)
Chart Area in PowerPoint 2013 for Windows
You May Also Like: Make A Connection with Your Audience Through Questions | Stars PowerPoint Templates


Microsoft and the Office logo are trademarks or registered trademarks of Microsoft Corporation in the United States and/or other countries.