Apply predefined Chart Styles to your charts in PowerPoint 2011 for Mac. With one click, predefined combinations of various chart elements can be easily applied.
Author: Geetesh Bajaj
Product/Version: PowerPoint 2011 for Mac
OS: Mac OS X
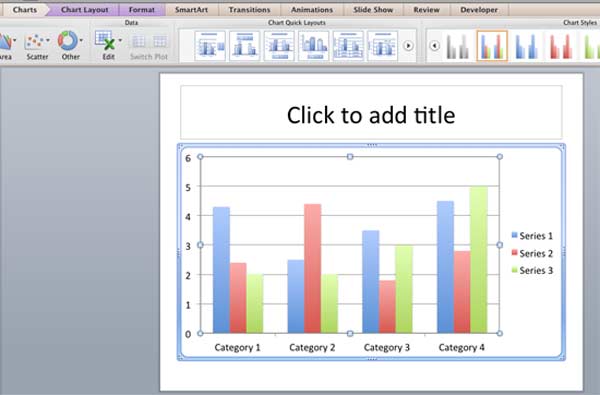
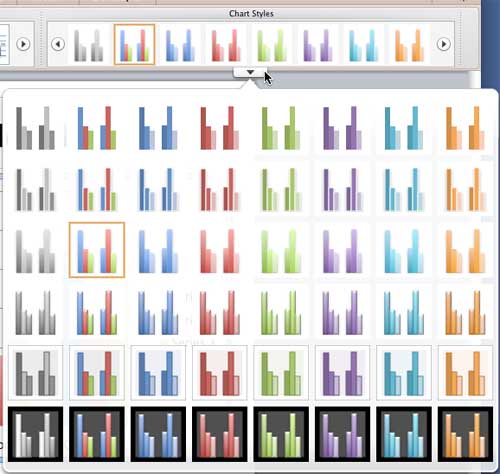
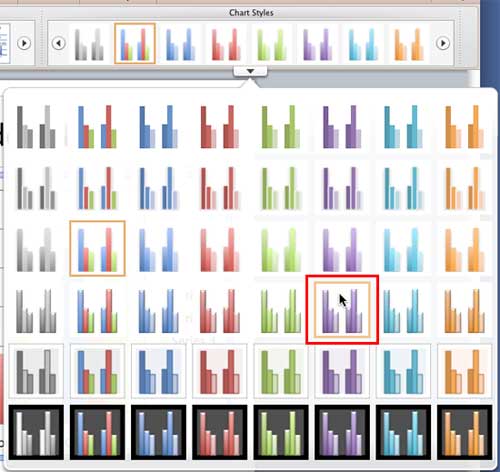
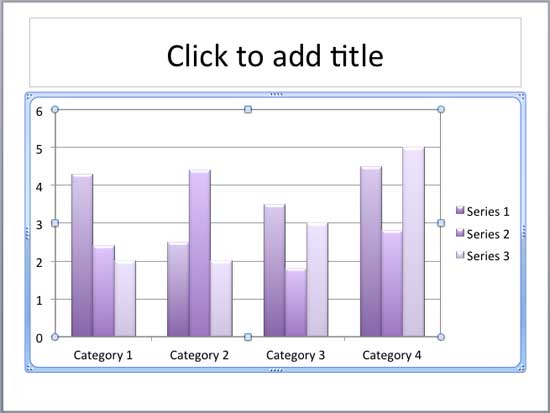
Adding charts and editing them is a much more intuitive and easy task in PowerPoint 2011 for Mac than it used to be using older versions of PowerPoint. PowerPoint now makes repetitive formatting easy and consistent with the Chart Styles option. There are some predefined styles that contain combinations of formatting elements such as fills, outlines, and effects. PowerPoint provides various such styles to choose from, and all these styles are based on Office Themes. Just a couple of clicks can make your chart look great.
To apply a Chart Style, you first need to have a chart in your presentation. Insert a chart, and then follow these steps to apply Chart Styles in PowerPoint 2011 for Mac:


See Also:
Chart Basics: Chart Styles (Glossary Page)
Chart Styles in PowerPoint 2016 for Windows
Chart Styles in PowerPoint 2013 for Windows
Chart Styles in PowerPoint 2010 for Windows
Chart Styles in PowerPoint 2007 for Windows
You May Also Like: Don’t Hold Yourself Back. Speak Up! | Zambia Flags and Maps PowerPoint Templates


Microsoft and the Office logo are trademarks or registered trademarks of Microsoft Corporation in the United States and/or other countries.