Indezine Logo


Chart Elements in PowerPoint 2007 for Windows

Learn about chart elements in PowerPoint 2007 for Windows. These chart elements include Series, Categories, Axes, Plot area, Legend, Chart Title, and many more.


Author:

Product/Version: PowerPoint 2007 for Windows

OS: Microsoft Windows XP and higher


Learn PowerPoint

Show Some Love to PowerPoint Tables


Charts in PowerPoint comprise several elements that we call Chart Elements. Typical chart elements include:

  • Series (and this could be one or more series with values)
  • Categories (again this can be one or more categories)
  • Axes (horizontal, vertical, and in some cases, a third axis as well)
  • Plot area (the active chart area)
  • Legend
  • Chart Title
  • And many more...

In this tutorial, we'll learn more about these individual chart elements. Before starting, we are assuming you already have a chart inserted on a PowerPoint slide. If not, check out this page that shows how you can place a new chart on a slide in PowerPoint 2007 for Windows.

Selecting Chart Elements

Follow these steps to select individual chart elements.

  1. Select the chart, which activates Chart Tools tabs on the Ribbon, as shown in Figure 1.
  2. Chart Tools
    Figure 1: Chart Tools
  3. You can select any individual chart elements, such as the plot area, columns, legend, etc. However, with so many chart elements close to each other, and sometime overlapping each other, it's easier to use another selection process.
  4. Select the Chart Tools Layout tab of the Ribbon (see Figure 2).
  5. Chart Tools Layout tab
    Figure 2: Chart Tools Layout tab
  6. Note: The Chart Layout and Format tabs are Contextual tabs. These tabs are special tabs in the Ribbon that are not visible all the time. They only make an appearance when you are working with a particular slide object which can be edited using special options.
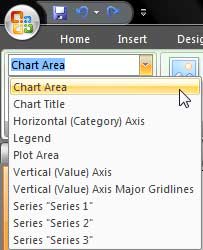
  7. Under the Current Selection group (extreme left on the Ribbon tab), you'll find a drop-down list of chart elements, as you can see highlighted in Figure 3. This drop-down contains a listing of all chart elements in the active chart. Selecting individual elements in this list also selects that element within the actual chart.
  8. Chart elements in the dropdown list
    Figure 3: Chart elements in the drop-down list
  9. Note: Figure 3 displays the chart elements for a typical column chart. If your chart type is different, you will see different chart elements.
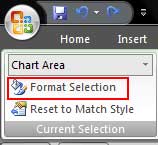
  10. Select any element in the drop-down list and click the Format Selection option right below the same drop-down (see Figure 4). For example, if you have selected Plot Area in the drop-down list, clicking Format Selection will give you options to format the Plot Area.
  11. Format Selection
    Figure 4: Format Selection
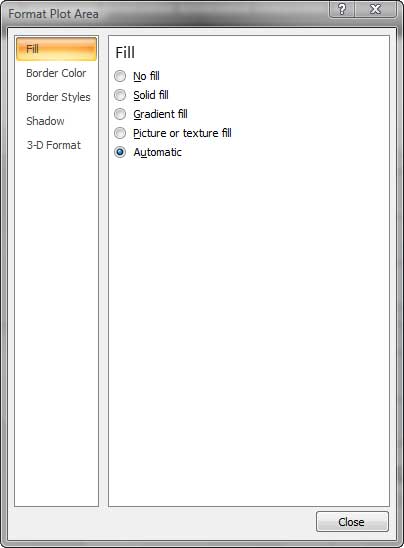
  12. With the Plot Area chart element selected, clicking the Format Selection option brings up Format Plot Area dialog box, as shown in Figure 5. If you had some other chart element selected, the dialog box that you would end up with would have options pertaining to your selection. So, this is all very logical and intuitive.
  13. Format Plot Area dialog box
    Figure 5: Format Plot Area dialog box
  14. Format the Plot Area (or another chart element you may have selected) as required, and then click Close to get back to your chart.

Chart Elements

Although different charts have differing chart objects, these are the common chart objects found in almost all chart types:

1. Axes

Most charts have two axes:

  • The bottom, horizontal axis (X axis), and
  • The left, vertical axis (Y axis)

Some charts may also have a Z axis. Learn more about PowerPoint's chart axes.

2. Plot Area

The area within the axes is known as the plot area. The plot area includes the series, gridlines, etc. And the legend and titles are normally placed outside the plot area.

3. Gridlines

Most of the time, you may see horizontal gridlines but vertical gridlines are also available, and both of them can be formatted as required.

4. Titles

There are two types of titles:

  • Chart title, by default placed above the chart, and
  • Axis titles, placed by default placed besides the axes.

5. Datasheet mode

Getting into datasheet mode in PowerPoint 2007 translates to launching Microsoft Excel with your data available to edit, add, remove, etc. This Excel sheet contains the values based on which the chart is created. In case you find yourself in a rare situation where you have PowerPoint 2007 installed without Excel 2007, then you'll see the regular Microsoft Graph datasheet that was the norm in the days of PowerPoint 2003 and previous versions.

6. Series

Every column of data within the data that's shown as a component of the chart is known as a Series.

7. Categories

A set of Series can be represented as a Category.

8. Values

These are the individual figures that identify each series. The font and placement for these can be formatted.

9. Legends

This is a box placed normally outside the plot area which provides captions (and/or color coding) to the series, and helps identifying the series. Legends are automatically created with the chart itself, although you can opt to remove the legend.


See Also:

Chart Basics: Chart Elements (Glossary Page)

Chart Elements in PowerPoint 2013 for Windows
Chart Elements in PowerPoint 2011 for Mac
Chart Elements in PowerPoint 2010 for Windows
Chart Elements in PowerPoint 2003 and 2002 for Windows

You May Also Like: Business Storytelling: Conversation with Gavin McMahon | Army PowerPoint Templates


Popular Posts

Character Spacing in PowerPoint 2013
Explore Character Spacing options in PowerPoint 2013.

Add Secondary Value Axis to Charts in PowerPoint 2013 for Windows
Learn how to add a Secondary Value axis to charts in PowerPoint 2013 for Windows.

Ten Easy Topics for Pecha Kucha
But what are simple topics, that excite you, and are interesting to your audiences? Of course, if you already have a topic, you need not read further, but if you are still looking for ideas, here are ten easy topics that you can use for your Pecha Kucha presentations.

Drawing Arcs in PowerPoint
Explore how you can draw an Arc shape in PowerPoint.


Handmade Slides: Pushpins for PowerPoint

These “pushpin” graphics are already placed in PowerPoint slides. Just copy them and paste within your slides to create a look that makes a picture, shape, or anything else appear as if it has been pushed onto a surface, board, or wall with a pin! These ready-made pushpins are already within PowerPoint slides, and have been provided in five colors. Just copy them and paste them on your slides.

Download these Pushpins for just $19.99


Microsoft and the Office logo are trademarks or registered trademarks of Microsoft Corporation in the United States and/or other countries.

Home | PowerPoint | Photoshop | PowerPoint Templates | PowerPoint Tutorials | Blog | Notes | Ezine | Media Kit | Feedback | Site Map | About Us | Contact Us

Link to Us | Privacy | Testimonials

PowerPoint Backgrounds | Christian PowerPoint Backgrounds | Business PowerPoint Presentation Templates

Plagiarism will be detected by Copyscape

©2000-2023, . All rights reserved.