In PowerPoint, you can always fill your chart's data Series with
a picture of your choice. However, the problem with this approach is that your picture will be squeezed in different ratios to fit into the Data
Series, as shown in Figure 1, below.

Figure 1: Picture squeezed to fit into the Data Series
Notice that the picture we used (see Figure 2, below) has a width larger than its height, however the columns you saw in
Figure 1 have a width that's much smaller than the height, this discrepancy causes the columns to have squeezed fills, and that's
something that really does not get a higher aesthetic rating!

Figure 2: The picture we used as a fill for the columns
There is a way to solve this issue, especially if your Column chart includes only one Data Series. The solution is to use the required picture
(see Figure 2) as a fill for your chart's Plot Area, and make it
visible through individual Data Series. If that sounds a little confusing, do not worry. Follow these steps and you'll be able to do the same:
- Insert a
Stacked Column chart with only one Data Series on your
slide, or if you already have one, select it as shown in Figure 3.
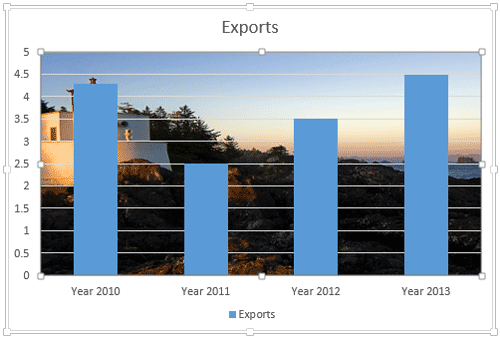
Figure 3: Stacked Column chart selected
- Select the Plot Area of the chart and
fill it with your required picture fill. Your chart's
Plot Area will show the selected picture background, as you can see in Figure 4.
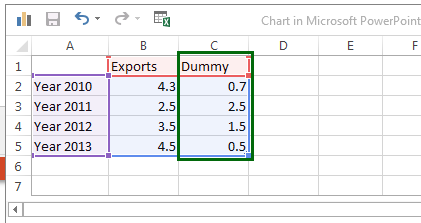
Figure 4: Plot Area filled with a picture
- Now, you need to edit your chart data.
Study your chart data and set a Y Axis maximum value
that's a little higher than the largest vale. In our sample data, 4.5 is the largest value, so we set 5.0 as the maximum value on the Y Axis.
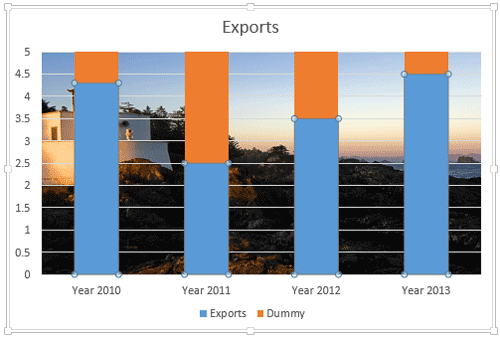
Figure 5: Difference between Data value and axis maximum added as dummy data
- Then calculate the difference between the individual column values (data values) and the axis maximum for the Data Series.
Then, add a new column to your chart data showing
this difference between this maximum value and the real value, we named this series Dummy. The Dummy series values for our sample
chart are shown highlighted in green within Figure 5, above.
- This adds a new Series to your chart as shown in Figure 6, the total of your real data plus the dummy data always equals 5 in
this instance.
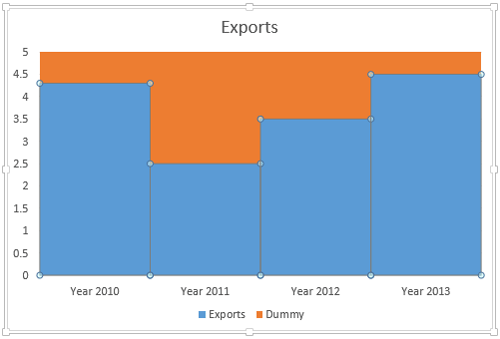
Figure 6: Dummy data added as second Data Series
- Now, set the Gap Width to No Gap (or
0%). Your chat will show no space between the Data Series as shown in Figure 7. You can also fill the newly added
dummy series with a chosen background color that you want to use as the background color of the chart.
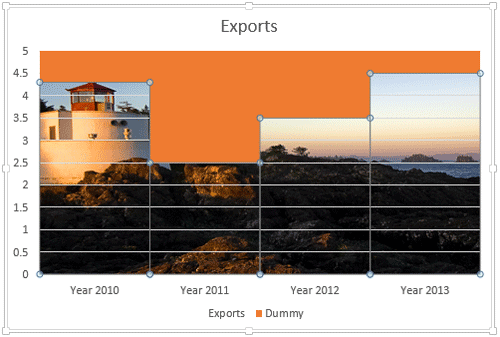
Figure 7: Data Series with 0% Gap Width
- Select the actual Data Series and set remove the fill. This will make the
background picture show through the Data Series, as shown in Figure 8.
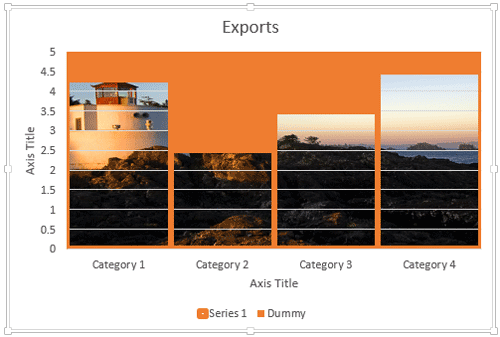
Figure 8: Data Series applied with No fill option
- As you can see in Figure 8, above, there is no gap between individual Data Series. To separate individual Data Series from each
other, add borders to them. The Border color should be same the color that you
have used to fill the dummy Data Series. You can also
increase the width of the border if required.
Figure 9 below shows our sample chart after we added borders to Data Series.
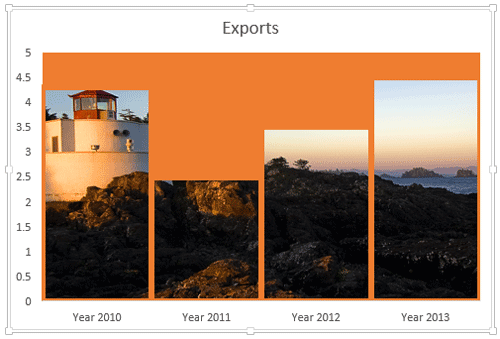
Figure 9: Data Series added with borders
- Optionally, you can remove all extra Chart Elements such as
Gridlines, Legend etc. Figure 9 shows our sample chart after all formatting
done. Compare Figures 1 and 10.
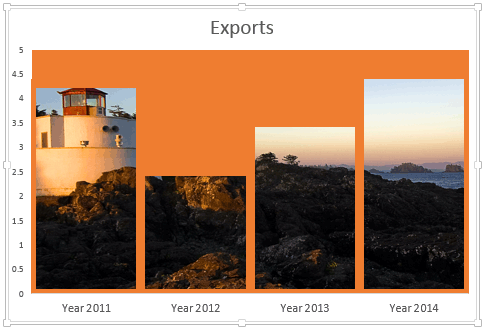
Figure 10: Column Chart with Background Fill
- Save your presentation.
