We already explored why and how you can add a Data Table to your existing PowerPoint chart. A Data Table is a tabular representation of chart data that's placed along with the chart itself, as shown in Figure 1, below. There are of course both pros and cons in using a Data Table. The pros stem from the fact that all content is available in one place and the cons are mainly because there's very little space left on the slide when you have both a chart and a table. To combat these cons, you may want to explore some advanced options that let you format your Data Table exactly as you want.
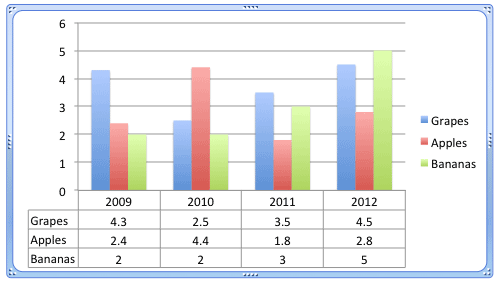
Figure 1: A chart with Data Table
You can format this Data Table in various ways such as removing some of the gridlines from the table, formatting text and gridlines, adding shadow, etc.
Explore more using the following steps in PowerPoint 2011 for Mac:
- Select the chart that already has a Data Table as shown in Figure 1, above. Then, select the Chart Layout tab, highlighted in red within Figure 2, below, of the Ribbon, and click the Data Table button, highlighted in blue within Figure 2. This step opens the Data Table gallery, as shown in Figure 2.
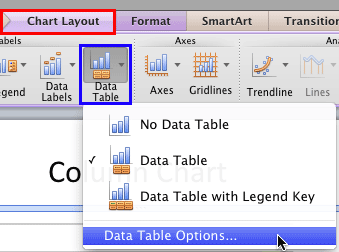
Figure 2: Data Table gallery - Within the Data Table gallery, select Data Table Options, which is the last option (refer to Figure 2 above). This action will summon the Format Data Table dialog box as shown in Figure 3, below.
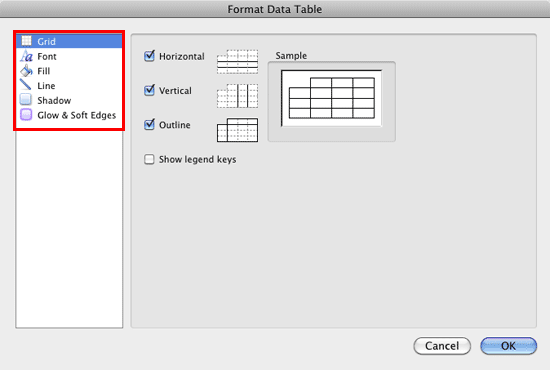
Figure 3: Format Data Table dialog box - Let us explore options within the sidebar of the Data Table gallery, as shown highlighted in red within Figure 3, above, in the order of their appearance:
Grid
- Provides you with various options in the form of check-boxes as shown in Figure 3, above to show/hide Horizontal, Vertical, and Outline grids within the Data Table. You can also show/hide the legend keys (when this check-box is selected, the color blocks are displayed with the legends).
Font
- Includes options to format text within the Data Table. When the Font option is selected in the sidebar you can see two tabs within the dialog box: Font and Character Spacing as shown highlighted in red within Figure 4, below. These options work similarly to what we explain in our Format Text Dialog Box - Font Options in PowerPoint 2011 for Mac and Character Spacing in PowerPoint 2011 for Mac tutorials respectively. In Figure 4 you can see some changes made to the various options within the Font tab.
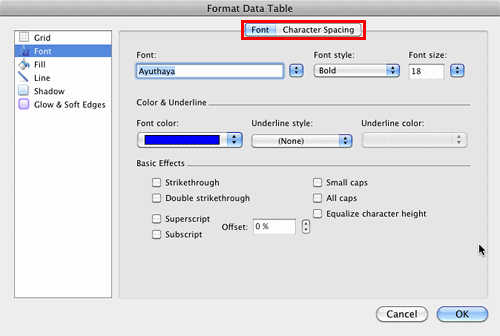
Figure 4: Options within the Font tab - In Figure 5, you can see the result of the above changes on the Data Table.
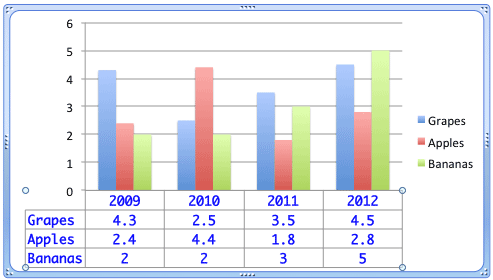
Figure 5: Data Table reflecting the text formatting done Fill
- Lets you add a fill behind text within the Data Table. You can choose from Solid, Gradient, Picture or Texture, or Pattern tabs (highlighted in red within Figure 6, below). Again, these options work similar to what we explain in our Fills for Shapes in PowerPoint 2011 for Mac tutorial. Although the linked tutorial explains Shape fills, the techniques work the same way for Data Tables too.
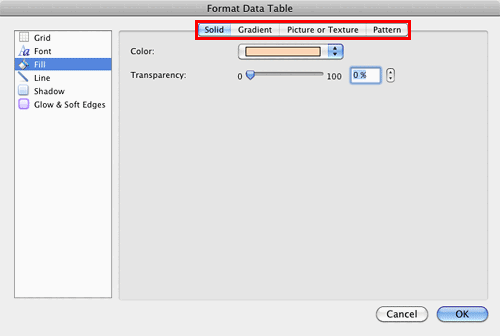
Figure 6: Fill options for the Data Table - In Figure 7, you can see the effect of selecting a solid fill for the Data Table. Note that Series names don't show any fill behind them.
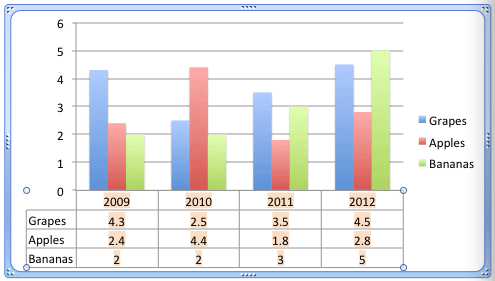
Figure 7: Data Table reflecting the effect of selecting a solid fill Line
- Includes options to format the gridlines within the Data Table as shown in Figure 8, below. You can select from Solid, Gradient, or Weights & Arrows tabs (highlighted in red within Figure 8) to choose various line formatting options as required. To learn more about how to use these options, refer to our Formatting Lines (and Shape Outlines) in PowerPoint 2011 for Mac tutorial. Again, even though the tutorial explains Shape lines, the techniques work for Data Table as well.
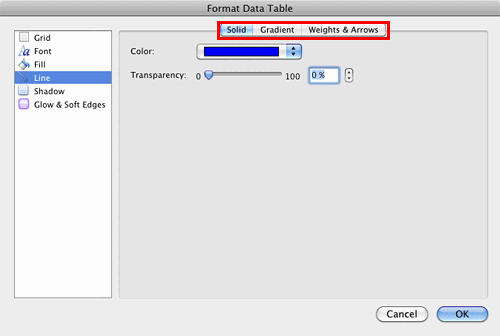
Figure 8: Line editing options for the Data Table - Figure 9, shows our sample Data Table after applying some line formatting.
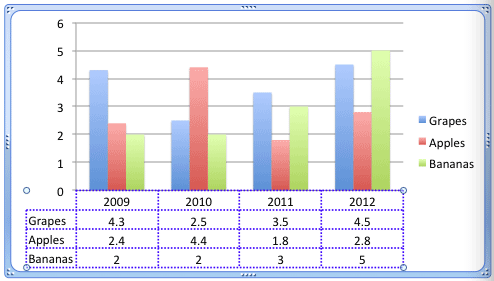
Figure 9: Data Table with formatted Gridlines Shadow
- You can add a shadow effect to the Data Table and edit the effect as required using the Shadow options that you see in Figure 10, below. To learn more about how to apply and edit Shadow effect, refer to our Advanced Shadow Effect Options in PowerPoint 2011 for Mac tutorial.
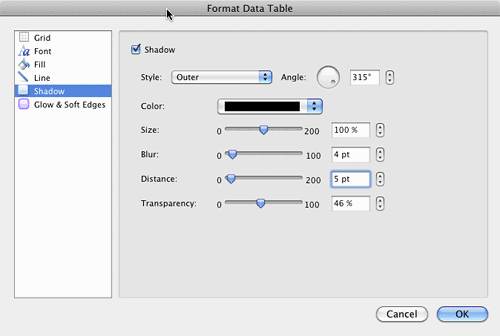
Figure 10: Options to add and edit Shadow effect to the Data Table - Figure 11, shows our sample Data Table added with Shadow effect. We have hidden the Gridlines in the sample to make the Data Table look less crowded. Do note that the Shadow effect is applied not to the text but to the box area within which the text is contained.
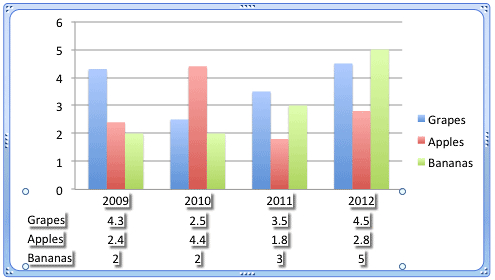
Figure 11: Data Table added with Shadow effect Glow & Soft Edges
- Among these two options as shown in Figure 12, below Glow option adds a halo of selected color around the Gridlines of the Data Table whereas the Soft Edges effect adds an eaten-up, feathered edge to the fill and Gridlines of the Data Table. Do note that both these effects are applied not to the text but to the box area within which the text is contained.
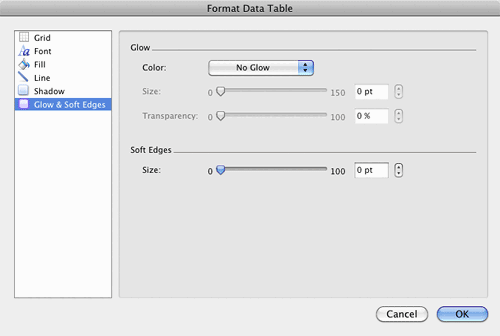
Figure 12: Glow & Soft Edges options for Data Table - Select and apply any of the Data Table formatting options as required.
- Save your presentation often.


