Learn how to edit chart data in PowerPoint 2013 for Windows. This data is typically stored in an embedded Excel sheet.
Author: Geetesh Bajaj
Product/Version: PowerPoint 2013 for Windows
OS: Microsoft Windows 7 and higher
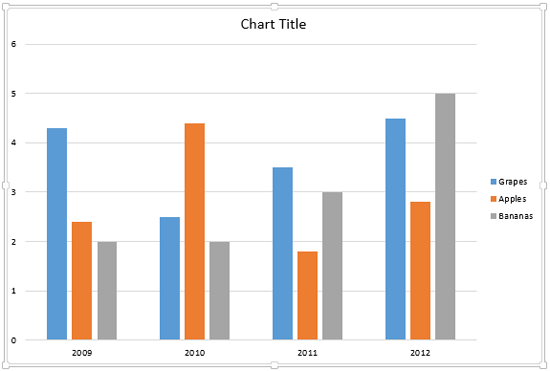
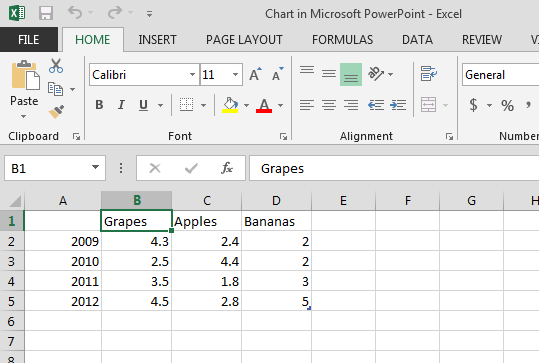
When you insert a new chart in PowerPoint 2013 for Windows, you might notice that an instance of the Excel sheet containing some dummy data for your chart pops up within PowerPoint. You then change data as needed within Excel sheet to auto-update the chart on your slide. However, this Excel instance that stores your data has no separate existence, and there's no separate Excel sheet that contains your data. In fact, this Excel sheet is stored within your PowerPoint presentation itself.
To create and edit charts in PowerPoint 2013 for Windows, you must also have Excel 2013 installed.
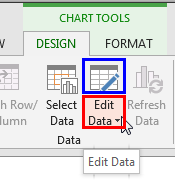
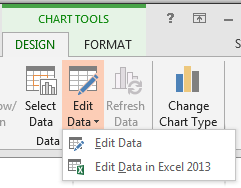
Well, what do you do if you want to edit the chart data after a week, a month, or even a year after you created that chart? Simple, you just summon the instance of the Excel sheet containing the chart data again and make the required changes.
Follow these steps to learn more in PowerPoint 2013 for Windows:


See Also:
Chart Data: Edit Chart Data (Glossary Page)
Edit Chart Data in PowerPoint 2016 for Windows
Edit Chart Data in PowerPoint 2011 for Mac
You May Also Like: How to Give People the Level of Detail They Need in Your Presentation | Entertainment PowerPoint Templates


Microsoft and the Office logo are trademarks or registered trademarks of Microsoft Corporation in the United States and/or other countries.