When you place a chart on your slide that contains a Z-axis, you will notice that these 3D charts are different from conventional 2D charts. Primarily, these charts have distinct walls and a floor. Also by default, these walls and floor show no fill or even a border, as you can see in the chart shown in Figure 1, below. The lines you see within the walls are gridlines, and not borders. If your slide background is a solid color like white or black, these defaults could work best for you. However, you may want to play a bit with changing the fill or line attributes for the wall and floor elements. Do remember though that you should leave these elements in their default state unless you have a compelling reason to change them!
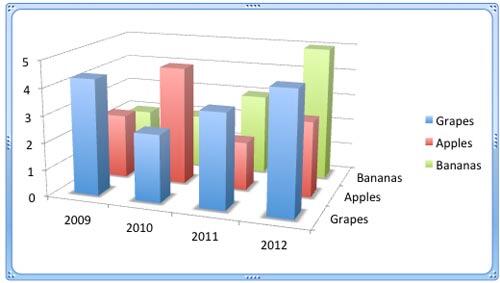
Figure 1: By default 3D charts show no fills and no borders
Here's one scenario in which formatting the walls and floor may help. Let's imagine your slide background is filled with some picture or texture. This may cause your chart columns to appear merged with the background. In such a situation, you may want to make your chart columns prominent by formatting the walls and floor of your 3D chart.
Follow these steps to format the walls and floor of 3D charts in PowerPoint 2011 for Mac:
- Open your presentation, navigate to the slide that includes the 3D chart. Select the chart wall(s) or chart floor as required, following any of the options explained below:
Select both Back and Side Walls
- Click on the space between the Gridlines to select both the Side and Back walls together. Right-click (or Ctrl+click) to bring up a contextual menu, and select the Format Walls option as shown in Figure 2, below. This way, any formatting will apply to both the side and back walls.
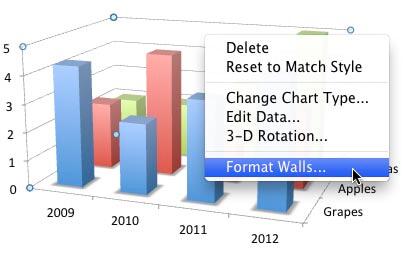
Figure 2: Format Walls option selected Select only Side Wall
- To format only the side wall, position your cursor on the side wall between the gridlines and click once to select both walls. Then slowly click on the side wall. Doing so deselects the other wall keeping only the side wall selected. Now, right-click (or Ctrl+click) and select the Format Side Wall option from the resulting contextual menu, as shown in Figure 3, below.
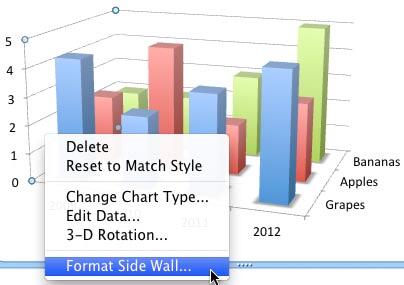
Figure 3: Right-click (or Ctrl+click) only the side wall to access Format Side Wall option Select only Back Wall
- To format only the back wall, position your cursor on the back wall between the gridlines and click once to select both walls. Then carefully click on the back wall. Doing so deselects the other wall keeping only the back wall selected. Now, right-click (or Ctrl+click) and select the Format Back Wall option from the resulting contextual menu, as shown in Figure 4, below.
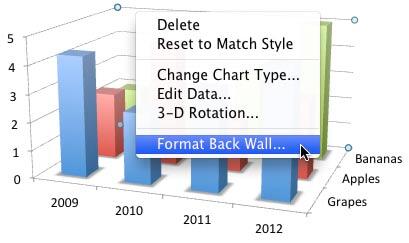
Figure 4: Right-click (or Ctrl+click) only the back wall to access Format Back Wall option Select the Floor
- To format the chart floor, first click on the chart floor to select it. Now right-click (or Ctrl+click) and select the Format Floor option from the resulting contextual menu, as shown in Figure 5, below.
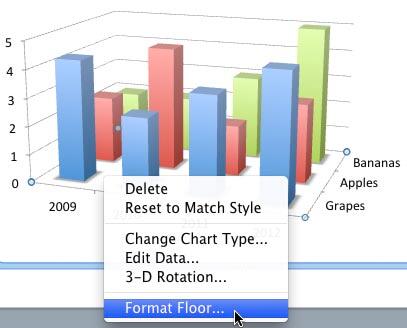
Figure 5: Right-click (or Ctrl+click) the chart floor to access the Format Floor option - All four ways explained above will summon a dialog box that you can see in Figure 6, below. Since we selected the Format Walls option to summon this dialog box, we can format both side and back walls together. Also, note that the dialog box in Figure 6 is named Format Walls. Even though the name will be different depending upon the chart element you have selected, the options included will always be similar.
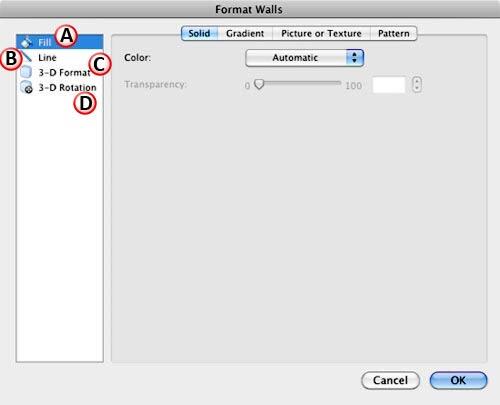
Figure 6: Format Walls dialog box - Options within the Format Walls dialog box work upon charts in the same way as the shape format options would work on shapes. Tutorials linked in the following sections pertain to shapes but the options work in the same way. Let us explore these options as marked in Figure 6, above:
A. Fill
- Adds a solid, gradient, picture, texture, or pattern fill to your chart wall(s) or floor.
B. Line
- Using this option you can add a line (border) to your chart wall(s) or floor and also set it's weight as required.
C. 3-D Format
- This option is used to apply and edit bevel effects. However, this option really doesn't work on chart wall(s) or the floor.
D. 3-D Rotation
- Rotates the entire chart as a single element.
- Select options as required. When done, click the OK button within the Format Walls dialog box. Figure 7, below shows our sample chart with formatted walls and floor. We have applied a pattern fill to the walls, a solid fill to the floor and also added borders. Compare Figures 1 and 7.
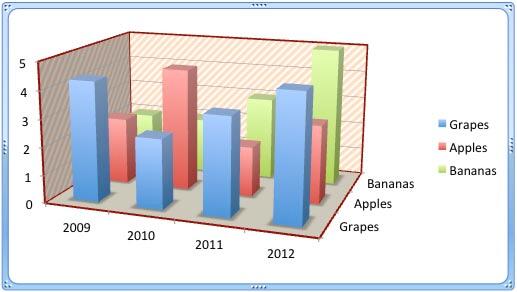
Figure 7: Chart with formatted walls and floor - Save your presentation often.


