![]()
This is the print version of this page. All content is copyright Indezine.com 2000-2023.
![]()
Page 149 of PowerPoint tutorials, presentation essentials, personality interviews, and PowerPoint news.
Previous Archive Page | Next Archive Page
Author: Geetesh Bajaj
Product/Version: PowerPoint
October 9, 2013

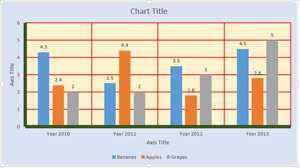
Adding a title to your chart is always a good option since it provides your audience with an idea of what your chart is all about. Yes, PowerPoint does provide this Chart Title option -- but before you go ahead and use this option, you must decide if you need a chart title or not. Here are some guidelines that will help you make that decision.
Learn how to add a Chart Title in PowerPoint 2011 for Mac.
October 8, 2013

In this issue, we bring you the third and final series of our Sticky Tape graphics -- these are textured! Jamie Garroch discusses his add-in that goes all the way back to address a need for those enterprise clients who still use PowerPoint 2003! And then we have some awesome fall leaves available for you as PowerPoint ready graphics. PowerPoint 2013 for Windows users can learn about ways to draw a perfect square. And also how you can insert charts and then play with Chart Styles. PowerPoint 2011 for Mac users can explore data tables within charts. And finally, do not miss the new discussions and templates of this week!
Read Indezine's PowerPoint and Presenting News.
October 8, 2013
Although a chart may seem like a single object at first glance, look closer and you will find that each chart comprises several individual elements that we call chart elements in PowerPoint. These chart elements include Series (and this could be one or more series with values), Categories (again this can be one or more categories), Axes (horizontal, vertical, and in some cases a third axis as well), Plot area (the active chart area), Legend, Chart Title, and many more. In this tutorial we'll learn about these individual PowerPoint chart elements and also how to select and edit them.
Learn about various chart elements and how to select and edit them in PowerPoint 2013.
October 7, 2013

The Indezine Halloween Kit is a self-contained set of content that provides everything you need to create picture slides for PowerPoint. This kit contains 5 Standard and 5 Widescreen Halloween PowerPoint Themes, a scary font, some silhouette pictures, scrapbook style embellishments, some pictures, and even a few sample slides.
Download and use this kit now.
October 7, 2013

Did you want to move the location of the legend in your chart? Or do you always need to add a Data Table? Does PowerPoint's default layout options for all chart elements work for you? Or perhaps it doesn't? If you identify with any of these scenarios, you will love the way you can play with different layouts for your charts using the pre-defined Chart Quick Layouts feature. This essentially is a collection of some pre-arranged layouts containing chart elements. With just a couple of clicks you can change the entire look of your chart, as explained in this tutorial.
Learn about advanced options for Data Tables in PowerPoint 2011 for Mac.
October 4, 2013

These "sticky tape" graphics have textured look and are already placed in PowerPoint slides - just copy them and paste within your slides to create a look that makes a picture, shape, or anything else appear as if it has been stuck on a surface, board, or wall with tape! These ready-made sticky tape segments are already within PowerPoint slides -- and have been provided in 10 different colors - and all colors have various transparency variations.
Download these sticky tapes, and use them in your slides.
October 4, 2013
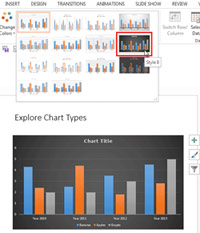
Making a chart look different involves so much because each chart has almost 10 or more elements that contribute to its appearance. If you start formatting all these 10 elements individually, it will take a long time to get results. And the same attributes will be difficult to apply to any other chart within the same presentation. The saviour in this case can be the amazing Chart Styles option in PowerPoint 2013. These Chart Styles include pre-defined combinations for various chart elements and include effects and layouts that can change the look of your chart completely. And, all these styles are based on Office Themes. Just a couple of clicks can make your charts look distinctive.
Learn how to apply a pre-defined Chart Style to your charts in PowerPoint 2013.
October 3, 2013

These Fall Leaves Clip Arts for PowerPoint are ready to use clip-art graphics that you can use within your PowerPoint presentation slides. These clip art graphics are available in black and white colors -- both variations are contained within two separate sample presentations you can download. Copy the clip art graphics of your choice from the downloaded presentations, and paste them into your PowerPoint presentation slide, or you can also paste them into a Word document or an Excel worksheet. Additionally, these Fall Leaves graphics are vector shapes, so you can easily edit them within your Microsoft Office program.
Download and use these fall leaves in your slides.
October 3, 2013
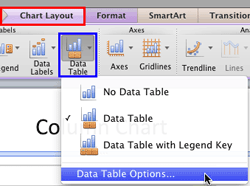
We already explored why and how you can add a Data Table to your existing PowerPoint chart. A Data Table is a tabular representation of chart data that's placed along with the chart itself. There are of course both pros and cons in using a Data Table -- the pros stem from the fact that all content is available in one place and the cons are mainly because there's very little space left on the slide when you have both a chart and a table. To combat these cons, you may want to explore some advanced options that let you format your Data Table exactly as you want.
Learn about advanced options for Data Tables in PowerPoint 2011 for Mac.
October 2, 2013
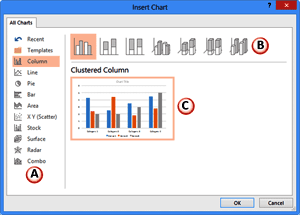
When you need to describe the relation between two or more sets of values in your presentation, charts are probably your best option. First of all, you should decide upon the chart type you require based the data you are going to present. Then, follow these steps to insert a chart on your slide in PowerPoint 2013.
Learn how you can insert a chart on a slide in PowerPoint 2013
October 1, 2013

In this issue, we first explore Sam Horn's amazing keynote session at the recently concluded Presentation Summit conference. PowerPoint 2013 for Windows users can learn about reordering objects, and ways to draw a perfect circle. PowerPoint 2011 for Mac users can explore ways to work with data within charts. And finally, do not miss the new discussions and templates of this week!
Read Indezine's PowerPoint and Presenting News.
October 1, 2013
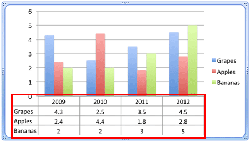
Copy a bunch of Excel cells into PowerPoint or even create a table within PowerPoint itself and type in some data -- this is something that can be difficult for most audiences to comprehend because figures don't show any trends, at least no visual trends. The solution typically is to add a chart on your slide that's based on the same data data so that you can compare two or more sets of values more visually and intuitively. However, there may be times when you need to show both the chart and the underlying data. To make this possible, you can use PowerPoint's Data Table option -- this way, not only you get the pictorial representation of the values, but also get to show the same values in the form of a table right below the chart.
Learn about showing the Data Table for charts in PowerPoint 2011 for Mac.
September 30, 2013

Jamie Garroch, CEO of GMARK Ltd. and owner of i-present.co.uk, founded the company to provide presentation professionals with presentation software, content and training. Jamie uses a range of presentation and e-learning tools on PC and Mac from PowerPoint to Keynote, Adobe CS and iSpring for presentations and Articulate Storyline for e-learning. He also uses PowerPoint as a programming environment to create authoring automation for his company's productivity needs, custom add-ins for clients and off-the-shelf products for presentation designers. In this conversation, Jamie discusses the new Color Swatch add-in for PowerPoint 2003.
September 30, 2013

OK -- you want to draw a square box on your slide -- and none of the options within the Shapes gallery are called "Box" or "Square"! Yes, there's a Rectangle option but the shapes drawn using this option almost never have the same width and height. The solution may be to manually resize the Rectangle so that it has the equal proportions of a Square but that again is a long process -- don't you want something easier and quicker? The short answer must be Yes! We already showed you how to draw a perfect circle. Now, we'll show you how to draw a perfect square in PowerPoint 2013 using those same principles.
Learn how to draw a perfect square in PowerPoint 2013.
September 27, 2013

Most of the time, you must start from scratch and then insert a new chart on your PowerPoint slide. This of course brings up Excel with some dummy data -- and indeed you can type in your own data to replace this dummy data. However, what if you already have some data that's within an Excel sheet -- why can't you use that data to create your PowerPoint chart? Why does PowerPoint in fact insist that you use the new Excel sheet and not any of your existing Excel sheets? And even if you must use that new Excel sheet, where does that sheet reside -- and can't you bring in your own data to that sheet in a way that does not make you type everything all over again? Wow -- that's a bunch of very genuine questions -- this article will attempt to provide you with some answers!
Learn how to use already available Excel data to create charts in PowerPoint 2011 for Mac.
September 26, 2013

Drawing shapes is drop-dead easy with the vast repertoire of ready-made shapes available in PowerPoint 2013. You can easily insert these shapes with a click or two, but once in a while you may get stumped. One such scenario is when you need to draw a circle -- you'll find that PowerPoint's Shape gallery has no Circle shape! Don't worry -- all is not lost because there is an Oval shape and that can be used to draw a perfect circle.
Learn how to draw a perfect circle in PowerPoint 2013.
You May Also Like: 2013 Annoying PowerPoint Survey Results: Conversation with Dave Paradi | The Golden Triangle - Presenter, Audience, and Slides


 in PowerPoint 2013 for Windows")

Microsoft and the Office logo are trademarks or registered trademarks of Microsoft Corporation in the United States and/or other countries.