![]()
This is the print version of this page. All content is copyright Indezine.com 2000-2023.
![]()
Page 152 of PowerPoint tutorials, presentation essentials, personality interviews, and PowerPoint news.
Previous Archive Page | Next Archive Page
Author: Geetesh Bajaj
Product/Version: PowerPoint
November 15, 2013

PowerPoint provides two types of shapes: open and close shapes. Shapes, such as rectangles, circles, etc. are closed shapes. Regular line shapes, such as straight lines, curves, scribbles, etc. are open shapes. Arrowheads can be added only to open shapes. That's because an arrow needs a pronounced, visible beginning and end.
Learn how to format arrowheads in PowerPoint 2013.
November 14, 2013
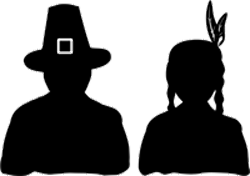
These Thanksgiving clip arts for PowerPoint are ready to use clip-art graphics that you can use within your presentation slides. These graphics are available in black and white colors -- both variations are contained within a separate sample presentation you can download. Just copy the clip art graphic you like and paste into another PowerPoint slide, or even a Word document or Excel worksheet. Additionally, these Thanksgiving graphics are vector shapes, so you can easily edit them within your Microsoft Office program.
Download and use these graphics.
November 14, 2013

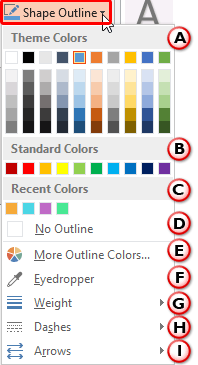
We have already explored how to format shape outlines and change their weight. In this tutorial, you will learn how to apply a dash style to shape outline. A dashed line in PowerPoint 2013 can have plenty of variations: from a line with fewer dashes to ones with longer or smaller dashes, or even alternating small and long dashes. So why do you add a dash style to your outline? That's a good question and the answer is quite simple -- sometimes, dash styles can add value to visual content, but use them judiciously. Many diagrams use dashed lines as a way to differentiate them from other content that have conventional, non-dashed lines.
Learn how to apply the dash attribute to shape outlines in PowerPoint 2013.
November 13, 2013

We have explained the basics of formatting shape outlines in PowerPoint 2013. Now we take you further ahead to explore how you can change line weight to make the outlines thinner and thicker. So why would you want to alter the weight of an outline? There are many reasons -- more often than not, you may want a line that's almost invisible or very thin -- this lets your audience focus on other areas. At other times when you want the attention of your audience to focus on a particular line, then you can do so by increasing its weight. In this tutorial, we will also cover compound lines such as those that encompass double or triple lines.
Learn how to change the weight attribute of shape outlines in PowerPoint 2013.
November 12, 2013

In this issue, we bring you the Indezine Thanksgiving PowerPoint Kit that contains everything you need to create Thanksgiving themed picture slides within PowerPoint. We have an exclusive interview with Gerry Praysman of SlideShark who discusses their milestone of 5 million presentations. We also bring you a listing of some PowerPoint 2013 books. And another exclusive interview with Payman Taei of Easy WebContent Presenter. PowerPoint 2013 for Windows users can learn about several fill types such as Textures, Patterns, Slide Background fill, and also the No fill option. PowerPoint 2011 for Mac users can explore more charting topics on Chart Area, Plot Area, and Gridlines. And finally, do not miss the new discussions and templates of this week!
Read Indezine's PowerPoint and Presenting News.
November 12, 2013
We have already showed you how to use fills for shapes in PowerPoint 2013. A fill is something that is contained within the confines of the shape. Similarly, shapes have another attribute known as the "line" or the "outline". A line is the perimeter surrounding a closed shape or the line itself within an open shape. In this tutorial, we'll explore the basics and thereafter provide links to specific, individual tutorials so that you can get acquainted with more advanced stuff.
November 12, 2013

As we explored in our earlier Chart Gridlines in PowerPoint 2011 for Mac tutorial, PowerPoint 2011 only shows Horizontal Major Gridlines on the chart. Yes, you can enable Vertical Gridlines too -- and more importantly you can format these Gridlines to appear exactly as you want them to show. In this tutorial, we will look at these format options.
Learn how to format Chart Gridlines in PowerPoint 2011 for Mac.
November 11, 2013

Flevy Tools lets you easily create automated diagrams such as Approach Diagrams, Step Box Diagrams, Harvey Ball Diagrams, Gantt Charts, etc. All graphics created are native PowerPoint objects that you can edit further. Even more amazing -- this tool is free. All organizations from startups to large enterprises can benefit by using Flevy Tools to jumpstart projects.
November 11, 2013

Shape fills such as solid colors, gradients, pictures, and textures can have a transparency attribute that lets you reduce the opacity of a fill so that the slide object or background behind shows through. Transparency is calculated in percentages and you can change its value all the way from 0 to 100%. Some fill options, such as pattern and slide background have no transparency options. To set a transparency value for your shape, follow these steps.
Learn how to apply transparency to shape fills in
PowerPoint 2013.
November 8, 2013

Payman Taei is the Founder of HindSite Interactive, an award winning web design and web development company in the Washington D.C. Area and the Founder of Easy WebContent, a cloud based Do It Yourself platform that allows everyone to easily create, edit and manage professional websites, presentations, infographics, banners and animations right in their browser. In this conversation, Payman Taei discusses Easy WebContent's Presenter.
November 8, 2013

After learning how to add different fills for shapes in PowerPoint 2013, now its time to learn how to remove any fill from a shape so that your shape only has an outline without a fill. Whenever you insert a new shape into a PowerPoint slide, it is filled with a solid color by default (or the default fill may be different depending on the Theme applied to your presentation). Most of the time, you may leave that unaltered, but there are times you want just the outline to be visible. It is in scenarios like these where it can be useful to learn how to remove any fill.
Learn how to remove fill from selected shapes in PowerPoint 2013.
November 8, 2013

Horizontal and Vertical gridlines are the lines that span wide and tall within the chart's Plot Area. These gridlines originate from one of the axes -- this makes the data easier to comprehend for the viewer. Gridlines may emerge from the horizontal and vertical axes -- by default you can see only Horizontal gridlines on the chart. Following are a few points to be considered when you work with Gridlines.
Learn about Chart Gridlines in PowerPoint 2011 for Mac.
November 7, 2013

You have already learned how to add different fills for shapes. Just like the Pattern fill option, there is one more hidden shape fill option which you can't access from the Shape fill gallery -- yet this is one of those fantastic PowerPoint features that you have to use to believe! The Slide Background fill option is different from other shape fill options because instead of filling something into the selected shape, it makes the slide background area behind the shape visible into the selected shape.
Learn how to add the slide background itself as a fill for selected shapes in PowerPoint 2013.
November 6, 2013

Here's a listing of some books that will get you up to speed learning PowerPoint 2013 for Windows -- all books are linked to Amazon pages where you can read book reviews and also see a few pages for each of the books so as to decide which books suits your learning style. If you actually buy something, we do get a reward from Amazon.
Explore books on PowerPoint 2013.
November 6, 2013

Pattern fills for shapes are two-color designs comprising lines, dots, dashes and checks. PowerPoint includes 48 patterns such patterns with names like Plaid, Weaves, Shingle and Zig Zag. Pattern fills for shapes are not included within the Shape fill drop-down gallery in PowerPoint 2013. But you can find this option buried within the Format Shape Task Pane. In this tutorial, we'll show you how you can access Pattern fill options.
Learn how to add pattern fill to selected shapes in PowerPoint 2013.
November 6, 2013

The Plot Area for a chart is the layer placed behind the actual chart. This layer typically has the axes on its perimeter. Also, the Data Series and Gridlines are placed above this layer. If the fill color for both the Plot Area and the Chart Area are the same, as they often are -- then you may miss the difference between both these chart elements. This default status works well. However, you can format the Plot Area separately to make it look prominent. You can change its appearance by altering fills and effects with just a few clicks.
Learn about the Plot Area for charts in PowerPoint 2011 for Mac.
You May Also Like: Text with Bites in PowerPoint | Business Presentations Survey


Microsoft and the Office logo are trademarks or registered trademarks of Microsoft Corporation in the United States and/or other countries.
