![]()
This is the print version of this page. All content is copyright Indezine.com 2000-2023.
![]()
Page 167 of PowerPoint tutorials, presentation essentials, personality interviews, and PowerPoint news.
Previous Archive Page | Next Archive Page
Author: Geetesh Bajaj
Product/Version: PowerPoint
May 5, 2014

You can export your presentation slides created within PowerPoint 2013 into a video clip in either WMV or MP4 formats. This is probably the easiest way to create quick videos from your slides, and is best suited for converting photo slides to video clips. You can also use this technique to create video clips from PowerPoint that can be uploaded to YouTube or other video sharing sites.
Learn how to export a presentation to a video clip in PowerPoint 2013.
May 2, 2014

One of the most fascinating qualities of color is contrast. Contrast is the quality that distinguishes one color’s luminosity from another. If you place black next to white, you will end up with striking contrast. But yellow placed next to white will certainly not provide the same contrast. That's because the difference in luminosity between black and white is so much more than the luminosity change between yellow and white.
Get started with learning more about Color and Contrast.
May 2, 2014

There's more to connectors than just drawing them to link shapes in PowerPoint 2013. You can format their line thickness, dash attributes, etc. In many ways, connectors are just like conventional lines in PowerPoint, especially where their formatting options are concerned -- so changing the color attributes of a connector is almost like changing the color of any line.
Learn how to change color of connectors in PowerPoint 2013.
May 1, 2014

You need to understand color theory better to understand color. And color theory is not really difficult at all. In fact, color theory is just a little science combined with some art. Learn a few guidelines and you may not become a color expert -- but you will still know enough to make awesome color decisions.
Get started with learning about color.
May 1, 2014

There are plenty of ways to make the Chart Area stand out on your slide. One method is to use the Fill and Line options to apply a fill and/or a border to the Chart Area. Additionally you can also apply any of the Effects that PowerPoint 2013 provides. Follow these steps to learn about the various Effects that can be applied to the Chart Area.
Learn how to add an effect to the Chart Area in PowerPoint 2013.
April 29, 2014

We start with an exclusive conversation with Rick Altman who discusses Presentation Summit 2014, a conference event slated to be held in San Diego this October. Celebrated author Jeremey Donovan then discusses his new co-authored book, Speaker, Leader, Champion. Also we explore the reinstated support for YouTube movies in PowerPoint 2010 and 2013. PowerPoint 2013 for Windows users can learn about fills and borders in charts, applying Themes, connectors, and more. PowerPoint 2011 for Mac users can learn about identifying and applying Themes. PowerPoint 2003 users will learn about creating a default template.
Read Indezine's PowerPoint and Presenting News.
April 29, 2014

When you create charts within PowerPoint, typically the Chart Area doesn't show any fill or any kind of formatting. The exception to this rule is if you have applied a particular Chart Style. Thus in most scenarios, the Chart Area is completely transparent with no fill or outline attributes. This default status works well most of the time since the Chart Area is just the area above which all chart elements are placed. However, if your slide background is crowded, then the Chart Area's transparency can pose a problem. To counter this issue, you can fill the Chart Area with a solid color, a gradient or even a pattern to add some visual separation from the slide's background.
Learn about the Fill and Line options for the Chart Area in PowerPoint 2013.
April 29, 2014

Connectors may be different than lines in some ways because they are linked to the shapes they connect -- move the linked shape, and the connector repositions itself with the shape. Yet in other ways, connectors are just like conventional lines in PowerPoint, especially when you explore their formatting options. You can thus add arrowheads to your connectors (or remove them), make your connector a dashed line rather than an undashed one, and also change the thickness of the connector.
Learn how to format connectors in PowerPoint 2013.
April 28, 2014

PowerPoint and a microphone -- what is it that holds these two together? More often than not, you use a microphone to record voice-overs for your slides. And this again is done in one of two ways. Recording voice-overs in PowerPoint using the Record Narration feature -- or using similar features provided through add-ins such as Adobe Presenter or Articulate Presenter. The other way is recording voice-overs outside PowerPoint and importing them. The first process is the quickest and the second may take a longer time -- whichever process you use, a nice microphone can work wonders. And that brings us to the reason behind this article -- what exactly is a "nice" microphone?
Explore some of the best microphones used for voice-overs in PowerPoint.
April 28, 2014
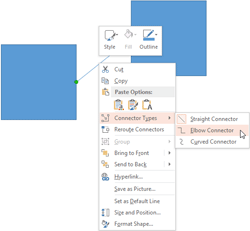
There are essentially three types of connectors that you can use to link shapes in PowerPoint 2013 -- also you can add any of these three connectors (Straight, Elbow, or Curved) as per your requirements. However, what will you do if you added a connector of one type and later realize that you should have used a different type? You need not delete the existing connector and draw another one because PowerPoint 2013 allows you to change from one connector type to another fairly easily.
Learn how to change between connector types in PowerPoint 2013.
April 25, 2014

Everything on a chart within PowerPoint 2013 is placed on top of the Chart Area -- this essentially is the entire area that encompasses your chart. Thus, the Chart Area is that part of your chart which is placed beneath all other chart elements. By default, the Chart Area doesn't possess any fill or any kind of formatting unless you have used a particular Chart Style. Even though this default status works well, you can opt to format as required. You can change the fill, border, and effect of the Chart Area, change the size and properties of the chart, and also change the font attribute.
Learn about the Chart Area in PowerPoint 2013.
April 25, 2014

Launch PowerPoint 2011 and you will typically see the Presentation Gallery -- you can accept the default Theme that shows up first or even click the Cancel button in this gallery to open a blank presentation with a new slide based on the same default Theme. When you type text within the placeholders of this slide, the text shows up in black over a white slide background. Most of the time this default look works, but you can change the defaults to something else -- for example, you can use any other PowerPoint Theme, including a custom Theme as the default.
Learn how to change the default Theme in PowerPoint 2011 for Mac.
April 24, 2014

Rick Altman is a California-based presentation consultant who has been helping organizations communicate better in public since before Microsoft developed PowerPoint. He has been hosting end-user conferences since 1989, and is the host of the annual Presentation Summit, now in its 12th season. He has authored 17 books on presentations and graphics, including the now-notorious Why Most PowerPoint Presentations Suck. In this conversation, Rick discusses the upcoming twelfth edition of his Presentation Summit conference, to be held in October 2014 in San Diego.
April 24, 2014
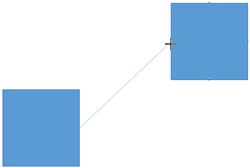
Connectors are lines that link different shapes, and yet they are somewhat different from conventional lines because - connectors, as the name implies stay connected to the shapes they link -- even if you move the actual shapes. You have already learned about connectors, and the types of connectors in previous tutorials -- in this tutorial, you will learn how you can draw connectors that link shapes.
Learn how to draw connectors in PowerPoint 2013.
April 23, 2014

Jeremey Donovan is Group Vice President of Marketing at Gartner Inc., the world's leading information technology research and advisory company with $1.6 billion in annual revenue. During his career, Jeremey has led successful teams focused on market research, new product development, marketing, acquisitions, and product management. He is a three-time TEDx organizer, a TEDx speaker, a coach for many TED and TEDx speakers, and long-time member of Toastmasters International. His other books include What Great Looks Like, How To Win the Toastmasters World Championship, and How To Deliver A TED Talk: Secrets Of The World's Most Inspiring Presentations. In this conversation, Jeremey discusses his new book, Speaker, Leader, Champion: Succeed at Work Through the Power of Public Speaking.
April 23, 2014
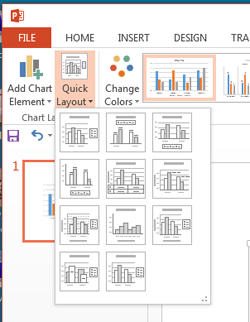
While working with charts in your presentation, you may want to move the location of the legend, or you may need to add a Data Table. Or perhaps the default layout doesn't work well for you. If you find any of these scenarios familiar, you can always choose from different layouts for your charts using the pre-defined Chart Quick Layouts feature. This essentially is a collection of some pre-arranged layouts containing various chart elements. With just a couple of clicks, you can change the entire look of your chart, as explained in this tutorial.
Learn how to apply preset Quick Layouts to your charts in PowerPoint 2013.
You May Also Like: Size & Properties Options for Chart Area in PowerPoint 2013 for Windows | Detach, Re-attach, and Delete Connectors in PowerPoint 2013


Microsoft and the Office logo are trademarks or registered trademarks of Microsoft Corporation in the United States and/or other countries.
