![]()
This is the print version of this page. All content is copyright Indezine.com 2000-2023.
![]()
Page 169 of PowerPoint tutorials, presentation essentials, personality interviews, and PowerPoint news.
Previous Archive Page | Next Archive Page
Author: Geetesh Bajaj
Product/Version: PowerPoint
May 22, 2014

Nancy Duarte has been Principal at Duarte Design since 1990. Her firm is in the heart of the Silicon Valley, and the client list is loaded with Fortune 500 companies. Her passion for business communications that are clear, meaningful and attractive has opened doors for her in a business world full of cluttered and complex visual communications. In this conversation, Nancy discusses Duarte's new Persuasive Presentations eCourse.
May 22, 2014

When you insert a new chart in PowerPoint 2013, you might notice that an instance of the Excel sheet containing some dummy data for your chart pops up within PowerPoint -- you then change the data within that instance of the Excel sheet to auto-update the chart on your slide. However, this Excel instance that stores your data has no separate existence -- there's no separate Excel sheet that contains your data. In fact, this Excel sheet is stored within your PowerPoint presentation itself.
Learn how to edit chart data in PowerPoint 2013.
May 21, 2014

Thomas Hayes is a master salesman, owner, CEO of Beantown Toys, visionary, author, and motivational speaker. With an iron will forged out of the tragic experience of losing a leg to cancer in childhood, Hayes has a compelling history to share with his audiences. Here are his secrets to being present in the moment with his audience.
Read this interview by Claudyne Wilder.
May 21, 2014
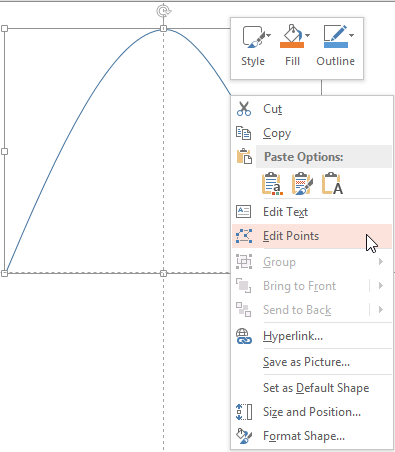
Several previous tutorials have explored the different drawing tools in PowerPoint 2013, and how they work -- we have worked with line drawing tools such as line, curve, freeform, and scribble. Using these line tools, you can draw almost anything in PowerPoint that you normally draw in high-end illustration programs. In this tutorial, you will learn how you can draw a parabola in PowerPoint 2013 using some of these drawing tools.
Learn how to draw a parabola in PowerPoint 2013.
May 21, 2014

The moment you add a Slide Number to your slides in Normal view, you expect to see them immediately thereafter. However many times you may not see any Slide Number – or worse, you may see the Slide Number in just a few of the slides! To remedy this situation, you have to ensure that both the Slide Master and the Slide Layout for any given slide does contain the Slide Master placeholder – this is something you can do only within Slide Master view, as explained within this tutorial.
Learn how to add Slide Numbers within Slides Masters in PowerPoint 2010.
May 20, 2014

We begin by looking at color models. We also have not one but three exclusive interviews this week. First of all, hear from SlideShare's Andri Kristinsson about their new Android app that lets you view presentations on a mobile device. Then we have Ryan Avery who discusses his Speaker, Leader, Champion book that he co-authored with Jeremey Donovan. Simon Morton of UK based Eyeful Presentations finally discusses his new book, the Presentation Lab. PowerPoint 2013 users can learn this week about creating anchor points for Connectors, data tables in charts, and working with comments. We also show you how you can create a Target diagram.
Read Indezine's PowerPoint and Presenting News.
May 20, 2014

In a chart, the Plot Area is the layer placed between the Chart Area and other chart elements such as Data Series and Gridlines. This layer typically also has the axes on its perimeter. Typically the Plot Area looks as if it is merged into the Chart Area because it is often transparent, and you can see the Chart Area through it. So, you may not be able to distinguish it from the Chart Area. This default status works well. However, you can format the Plot Area separately to highlight it. You can change its appearance by applying fills, borders, and effects with just a few clicks.
Learn about the Plot Area for charts in PowerPoint 2013.
May 19, 2014

In PowerPoint, you can always fill your chart's data Series with a picture of your choice. However, the problem with this approach is that your picture will be squeezed in different ratios to fit into the Data Series. This discrepancy causes the columns to have squeezed fills, and that's something that really does not get a higher aesthetic rating! There is a way to solve this issue, especially if your Column chart includes only one Data Series.
Learn how to make your chart columns to show the background fill in PowerPoint.
May 19, 2014

If you want to insert a video clip within your PowerPoint slide, spare a thought for why you would insert video clips in the first place. Most of the video clips are just added to grab attention. Fortunately, there are a few good reasons to adding video clips -- let us explore these, and then show you how you can add a video clip to your slide in PowerPoint 2013. Here are the good reasons.
Learn how to insert a video or movie clip in PowerPoint 2013.
May 19, 2014

When two or more people are involved in designing a presentation, there needs to be a channel for feedback. The Comments option works great for this purpose since it allows feedback without actually editing the slides themselves. A comment is a note that can be attached to any slide object or to a whole slide. You can add comments to write important notes for particular slide objects or for the slides themselves. This is a great way to provide feedback. Once a comment is added, you can edit the comment.
Learn how to add, edit, or delete Comments in PowerPoint 2010.
May 16, 2014

Color is something that we can all differentiate between. Most of us have little problem differentiating between red and blue, or even between red and pink. Color is also something that's been part of our lives, and part of our education system. Most of us learned about color before we learned the alphabet -- yet as the process of growing up occurred, many of us forgot what a joy color can be, especially mixing different colors to create new ones! To accommodate the different ways in which colors mix, we use different color models.
Learn about the various color models.
May 16, 2014

A Data Table in a chart is a tabular representation of chart data that's placed along with the chart itself. Just adding a Data Table essentially shows the table in the default formatting, and that may work most of the time. If it doesn't, you may want to explore some advanced options that let you format your Data Table exactly as you want. This may help you to highlight the text or grid lines so that you can make the Data Table stand out.
Learn about the options that are used to format the Data Table within a chart in PowerPoint 2013.
May 15, 2014

Andri Kristinsson is a Product Manager at SlideShare, spearheading the mobile team. The SlideShare mobile team is growing fast and recently launched its first app on Android after less than 6 months in development, with and iOS coming up soon as well. Prior to moving to the Silicon Valley in 2011, Andri was the founder and CEO of Innovit, a leading Entrepreneurship Center in Iceland where he helped hundreds of entrepreneurs grow through programs such as Startup Weekend and Startup Reykjavik, a TechStars global network accelerator. In this conversation, Andri discusses SlideShare's new Android app.
May 15, 2014

When you are collaborating on a presentation, or even if someone else is designing slides for you -- you will want to give feedback without actually editing the slides themselves. Comments are great for such scenarios -- a Comment is a note that you can attach to any slide object or to a whole slide. The ability to add comments into your PowerPoint 2013 presentation enables you to write important notes for particular slide object or for the slide and it is a great way to provide feedback to others about their presentation. Once you add a comment, you can edit the comment and even get replies for the comment.
Learn how to add, edit, or delete Comments in PowerPoint 2013.
May 14, 2014

Ryan Avery is an award winning speaker, best-selling author of the new book published by McGraw-Hill, Speaker Leader Champion: Succeed at Work Through the Power of Public Speaking. At age 23, Ryan won his first Emmy Award for producing Colorado State University's first ever multimedia package. He currently lives in Portland, OR with his wife Chelsea and they have been together for over six years. In this conversation, Ryan discusses his new book, Speaker, Leader, Champion that he co-authored with Jeremey Donovan.
May 14, 2014

PowerPoint 2013 has a ready to use collection of shapes that can be inserted with a click or two. You can add multiple shapes on the same slide and then flip, rotate, reorder, or group them as required to create your own combined diagrams and designs within PowerPoint. These combined shapes help create more involved diagrams such as a target diagram. In this tutorial we'll show you how simple it is to create a target by placing circles of various sizes one on top of the other using the techniques of formatting shapes already explained.
Learn how to draw a target diagram with multiple circles in PowerPoint 2013.
You May Also Like: Creating Curved Shapes in PowerPoint in PowerPoint 2013 | Hiding Chart Series and Categories in PowerPoint 2013 for Windows

 in PowerPoint 2011 for Mac")


Microsoft and the Office logo are trademarks or registered trademarks of Microsoft Corporation in the United States and/or other countries.