![]()
This is the print version of this page. All content is copyright Indezine.com 2000-2023.
![]()
Page 180 of PowerPoint tutorials, presentation essentials, personality interviews, and PowerPoint news.
Previous Archive Page | Next Archive Page
Author: Geetesh Bajaj
Product/Version: PowerPoint
September 4, 2014

Adding Data Labels is one of the ways in which you can make your charts in PowerPoint more effective, informative, and relevant for your audience. Once added, you can also further change the appearance of the Data Labels to suit your requirements, as explained in this tutorial.
Format Data Label Options for Charts.
September 4, 2014
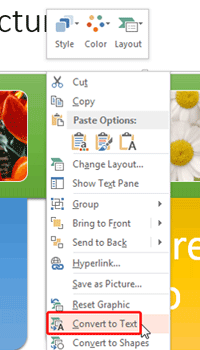
One of the best options to create new SmartArt is by converting your existing bulleted text to a SmartArt graphic. Many times though, you might want to do the reverse -- that is converting SmartArt back to bulleted text. When Microsoft introduced SmartArt in PowerPoint 2007, this reverse conversion was not possible but in later versions, Microsoft added this ability. Follow these steps to do the conversion of SmartArt to bulleted text in PowerPoint 2013 -- do note though that you will be left with just plain text rather than any shapes or visuals.
Learn how to convert SmartArt graphics to bulleted text in PowerPoint 2013.
September 3, 2014
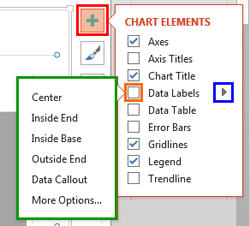
In a PowerPoint chart, Data Labels are used to display various types of information. You can display the value, and/or the name of the Chart Series, and/or the Categories right within or above the Series on the chart. Adding Data Labels can help the presenter reveal exact values along with the Series, so that he or she need not check on the Value axis to ascertain approximate values of any Series. In a default PowerPoint chart, you won't be able to see the Data Labels enabled.
Learn how to add Data Labels within charts in PowerPoint 2013.
September 3, 2014

SmartArt graphics are easily inserted infographics that typically place common PowerPoint shapes in relation to each other to create a strong message. You can of course change those individual shapes within SmartArt, as in changing a square to a circle or anything else -- but what many users don't realize is that you can do much more. You can actually move some shapes around within the SmartArt graphic if you want -- this sort of creative freedom lets you adapt existing SmartArt layouts to your liking to create something new.
Learn how to move individual shapes comprised within a SmartArt graphic in PowerPoint 2013.
September 2, 2014

We bring you another series of animated gears this time. We then explore Ellen Finkelstein's series of the new Outstanding Presentations workshops. Kurt Dupont then explains how the PresentationLand site demonstrates the use of databases within PowerPoint slides -- there are also ready-to-use slides that update with world news dynamically. And Naomi Baron thoughtfully explains why a printed book is not the same as an ebook, and why all this stuff matters to PowerPoint users! PowerPoint 2013 users can learn about SmartArt, Slide Transitions, Custom Shows, and measuring Diagonal Lines.
Read Indezine's PowerPoint and Presenting News.
September 2, 2014
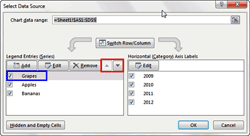
Typically the Data Series of a chart in PowerPoint is displayed in the exact sequence in which it is contained within the Excel sheet. If you want to change the order of the Data Series within the chart, you access the Excel sheet containing the chart data and reorder the columns representing the Data Series. But, what if you don't want to alter the Excel data, and want to reorder the Data Series within the PowerPoint chart itself? That's doable, and this tutorial will explain the process.
Learn how to change the order in which Chart Data Series are displayed in PowerPoint 2013.
September 2, 2014

Similar to how you can change an individual shape within the SmartArt, you can even resize shapes within a SmartArt graphic. This can be helpful if you want one shape to be larger than the others -- maybe you want one shape to stand out? Whatever be the reason behind you wanting to resize these shapes, this tutorial will explore how you can resize individual shapes within a SmartArt graphic in PowerPoint 2013.
Learn how to resize shapes within a SmartArt graphic in PowerPoint 2013.
September 1, 2014
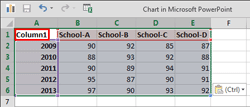
You may have started scratch with inserting a new chart on your PowerPoint slide. This of course brings up an instance of the Excel sheet with some dummy data - and indeed you can type in your own data to replace this dummy data. However, what if you already have some data that's within an Excel sheet - can you use that data to create your PowerPoint chart? The answer is yes, and that's what you are going to learn in this tutorial.
Learn how to use already available Excel data to create charts in PowerPoint 2013.
September 1, 2014

The default look of SmartArt graphics works great, and you may not want to change a thing! Yet, it's good to know that you can change your SmartArt graphics to other layouts, change the color of SmartArt graphics, or apply a SmartArt Style to make your SmartArt graphic appear distinct and unique. You can also change the actual shapes within a SmartArt graphic -- for instance you can change some circles in your SmartArt graphic to squares with a mere click or two!
Learn how to change shapes within a SmartArt graphic in PowerPoint 2013.
August 31, 2014

All shapes arranged with geometric precision - this can look very organized but also robotic and unnatural. What if you could make all these straight shapes look curved - almost as if they are hand-drawn? Won't that look more organic? If you agree, then you will certainly love this new series of irregular shapes for PowerPoint. Perfect shapes and boxes everywhere, all neatly lined up! Yes, such arrangements look clean, but also monotonous! What if you could make all these shapes curved, slanted, and natural looking - they are hand-drawn? Won't that look more organic? If you agree, then you will certainly love these new irregular shapes for PowerPoint.
Download and use these shapes in your slides.
August 29, 2014

Ellen Finkelstein is a Microsoft PowerPoint MVP, a recognized expert, speaker, trainer, and best-selling author on PowerPoint, presentation skills, and AutoCAD. Her articles have appeared in numerous magazines, newsletters, and blogs. She just announced the 2014 incarnation of Outstanding Presentations Workshop, her webinar series that allows everyone to learn from renowned presentation experts. In this conversation, Ellen talks more about this new webinar series.
August 29, 2014

After you create custom slide shows, you will want to present them to your audience. Yes, you could access the Custom Shows dialog box, and then select a show and then choose to play it -- but that's a long process indeed. In this tutorial, we will show how you can access the same custom show more easily. And then we will also show you how you can set any custom show as the default -- this means that when you actually play your presentation in Slide Show view, only the slides within the custom show you select will be shown!
Learn how to play custom slide shows in PowerPoint 2013.
August 29, 2014

When colors are changed for a SmartArt graphic, the only change that happens is to the fill colors of the the individual shapes within the SmartArt. Other niceties such as outlines or effects are not altered. Rather than individually add these attributes to your SmartArt, you can use the all-inclusive SmartArt Styles option to overcome this limitation. In this tutorial, you will learn how to apply SmartArt Styles to the selected SmartArt graphics in PowerPoint 2013.
Learn how to apply SmartArt Styles in PowerPoint 2013.
August 28, 2014

Kurt Dupont, based out of Belgium heads PresentationPoint, a company that creates several amazing PowerPoint add-ins. After his Computer Science studies, Kurt started with Andersen Consulting (Accenture nowadays) in Brussels. After 3 years he moved to the Brussels Airport Terminal Company that runs the Brussels airport - this last placement inspired the start-up of Take-off (now known as PresentationPoint) in 1998. In this conversation, Kurt discusses PresentationLand.com, a new site that showcases PresentationPoint products.
August 28, 2014

Sometimes, when you draw a line in PowerPoint that is slanted or sloped, you may thereafter want to know the length of your line. Believe it or not, there is no option to do this within the program. Unless you go and revisit your school geometry class!
Learn how to find out the length of a slanted (diagonal) line in PowerPoint 2013.
August 28, 2014

After inserting a SmartArt graphic in your slide, you can change the color for the entire SmartArt graphic -- this applies new colors to the entire SmartArt graphic including the various shapes it contains. However there may be times when you want one of the shapes to be colored differently -- in this tutorial we'll explore the fill, line, and effect options which can be applied to individual shapes within a SmartArt graphic in PowerPoint 2013.
Learn about fill, line, and effect options for shapes within SmartArt graphics in PowerPoint 2013.
You May Also Like: Learn PowerPoint 2013 for Windows: Change Callout Shapes for Data Labels | Learn PowerPoint 2011 for Mac: Adjust the Chart Series Overlap


Microsoft and the Office logo are trademarks or registered trademarks of Microsoft Corporation in the United States and/or other countries.
