![]()
This is the print version of this page. All content is copyright Indezine.com 2000-2023.
![]()
Page 210 of PowerPoint tutorials, presentation essentials, personality interviews, and PowerPoint news.
Previous Archive Page | Next Archive Page
Author: Geetesh Bajaj
Product/Version: PowerPoint
August 5, 2015

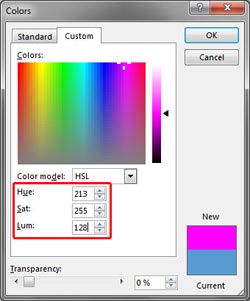
Assuming someone has provided you with an HSL (Hue, Saturation, and Luminosity) value of a color, and asked you to add a rectangle of that color to a slide in PowerPoint 2010, then how do you proceed? Let's also explore another scenario. What if you have started with a color that's close enough to what you need, but it's not the exact one. Maybe you need it to be a little less saturated? Again, you will benefit by working with the HSL color model rather than the RGB model.
Learn about how to work with HSL colors in PowerPoint 2010.
August 5, 2015

Creating graphics is not a cakewalk, but that need not dissuade aspiring designers -- especially since many programs now include more intuitive and easy to use abilities that can allow anyone to create awesome quality graphics. Xara Designer Pro X11, the newest version of a well-known graphic program includes all the illustration, photo editing, DTP and web design features you may need.
Explore Xara's Designer Pro X11, a program that has amazing graphics abilities.
August 4, 2015

You've all seen matrix diagrams? Now look at another perspective and explore something similar in a fortune teller origami! You can then read an exclusive interview with Yury Uskov of iSpring who talks about direct YouTube export from PowerPoint. And Dave Paradi, PowerPoint MVP looks at the larger picture when he wonders why spreadsheets end up on slides? All PowerPoint users will enjoy learning more about the HSL color model with more detailed sections on both Luminosity and Saturation. We will explore Hue next week. And we have some retrospective stuff too -- PowerPoint 2003 for Windows users can explore editing, adding, and deleting Points in shapes. Finally, don't miss the new discussions and templates of this week!
Read Indezine's PowerPoint and Presenting News.
August 4, 2015
Assuming someone has provided you with an HSL (Hue, Saturation, and Luminosity) value of a color, and asked you to add a rectangle of that color to a slide in PowerPoint 2013, then how do you proceed? Let's also explore another scenario. What if you have started with a color that's close enough to what you need, but it's not the exact one. Maybe you need it to be a little less saturated? Again, you will benefit by working with the HSL color model rather than the RGB model.
Learn about how to work with HSL colors in PowerPoint 2013.
August 3, 2015

Bucket diagrams are so expressive, useful, and direct in the message they provide. Yes, these diagrams have everything to do with buckets and the money they contain. While the buckets themselves represent a source or destination, the money represents the financial liquidity. Buckets show items in distribution, they represent the flow of things or display collections of items. An empty bucket can indicate the capacity to which it can be filled. A bucket pouring money in another could represent the distribution. You can have buckets that are full, empty, or somewhat full. And you can move the money from one bucket to another!
Download and use these bucket graphics.
August 3, 2015

Colors can be darker or lighter – and this in color terms is called Luminosity. Color can also be saturated (vibrant) or desaturated (neutralized). Desaturation can be done to a lesser extent or more, and when it happens to the maximum extent possible, that’s the same as completely neutralizing the color altogether – think about converting a colored picture to grayscale and you will understand what may be happening! This property of color is called Saturation. Now beyond Luminosity and Saturation lies the Hue of color. You can have a blue that’s dark or light, and even vibrant or neutralized. But you can also have a green, a red, an orange, a yellow, or any other color with those same attributes. This red, green, yellow, or blue property is nothing else but the Hue of the color.
Explore the role that Hue plays in the world of color.
July 31, 2015

You've all seen matrix diagrams - and these make it possible for you to explain related and dependent concepts. However, we decided to look at the matrix diagram from another perspective and found something similar in a fortune teller origami!
Download and use these Matrix slides.
July 31, 2015

Color is a fascinating subject – a subject that evokes enough creativity and pickles the minds of many. If we were to pause looking at color as a creative subject for just a brief amount of time, we would be able to explore it from a different perspective – the perspective of science! This color science will open new avenues for us to understand why colors behave in certain ways. For example, why do some colors look more vibrant than others? What is this quality that makes them shout? And why are some colors so muted – what makes them so understated and well-behaved? Well, the quality of color that makes all this shouting and mellowing happen is called Saturation, and believe it or not – it has everything to do with the color grey. We will learn more about what grey does to colors in this tutorial.
Explore how Saturation works within the HSL color model.
July 30, 2015

We explored the HSL color model broadly previously -- now we will look at Luminosity, one of its three properties. So what is Luminosity? Luminosity is the value that spans from pure black (darkest) to pure white (lightest). Now how does Luminosity influence any color? If we change the Luminosity values to 0 (zero) for a given colors, it does not matter what Hue or Saturation values they have – they will all be black! This reasoning is easy to explain using an analogy. In a very dark room, if you switch off the light you will be left with pitch darkness, and any object of any color will appear black. That’s precisely what's happening here too!
Explore how Luminosity works within the HSL color model.
July 29, 2015

I often hear about leaders asking staff members to put a spreadsheet on a slide. I see this in the work I do reviewing slides from participants before my customized corporate workshops. These huge tables of numbers are overwhelming. In my workshops I prepare makeovers of slides and show the participants how the key message of the spreadsheet could be communicated as a visual instead. It is not uncommon that the participant who prepared the slide says that the visual is clearer, but they have to put the whole spreadsheet on the slide because the boss requires it.
July 29, 2015

We learned about the RGB Color model in a previous tutorial -- and while computers can easily understand the fact that you mix red and green to end up with yellow, that's some strange logic to us humans which we shall never comprehend! For most of us, we understand that mixing yellow and blue makes green. So how can we stay within the RGB color model, which computers understand -- and mix colors more creatively to use a method which we humans can understand? This need for a more creative model gave birth to the HSL (Hue, Saturation, and Luminosity) color model.
Learn about Hue, Saturation and Luminosity, and how you can use these properties to mix colors.
July 28, 2015
How many times have you seen a picture of a light bulb on a slide? Your answer may be "many times", and so we get you some thoughts on alternatives to overcoming this visual cliché. Claudyne Wilder then explores ways in which you can hold the attention of your audience. We also bring you the Bucket diagrams offer.
PowerPoint for iPad users will enjoy learning about removing Places and the AutoSave option. You can also explore how you can open files in PowerPoint Online. PowerPoint 2007 for Windows users can meanwhile look at altering between Curved and Straight line segments. Finally, don't miss the new discussions and templates of this week!
Read Indezine's PowerPoint and Presenting News.
July 28, 2015

You have learned what the Edit Points option in PowerPoint is, and how it works. The Points you see and edit give you control over how you want a shape to look appearance-wise. Even then, sometimes you might find it difficult to edit a certain segment (a part of the line between two points) in a shape because there are no points available to manipulate -- or maybe there are far too many points! PowerPoint provides a simple solution for this problem -- you can add and delete points in a shape.
Learn how to add or delete points (vertexes) for a shape in PowerPoint 2003.
July 27, 2015

Yury Uskov is the founder and CEO of iSpring Solutions Inc., an international software company focused on providing professional e-Learning authoring tools based in PowerPoint. iSpring products are widely recognized as robust, effective, and extremely easy to use software with an outstanding price/quality ratio. iSpring is headquartered in Alexandria, VA. In this conversation, Yury discusses the new publish to YouTube feature in iSpring Pro 7.1
July 27, 2015

When you use any of the shapes available in PowerPoint, you are not limited to what their default appearance looks like. You may want to change a rectangle to a rhombus, or even edit a curved or freeform line differently. The good news is that you can do this by using the Edit Points option -- this almost makes PowerPoint a drawing program that provides you the option to play with vertexes (points), handles, etc. -- very similar to what you would do in Adobe Illustrator or CorelDRAW.
Learn how to change the appearance of a shape in PowerPoint 2003 using the Edit Points option.
July 24, 2015

Imagine that you are listening to a presenter droning on and on, using the same tone of voice and the same pace. Before long you start thinking about the vacation you want to take and the plans you would like to make for the weekend. Then, all of a sudden, you realize that you are no longer really listening. But wait, the presenter just said something you might need to know. It's too late. You have missed it.
You May Also Like: Add Links to Collections in Docs.com | Sign into Docs.com

 in PowerPoint 2013 for Windows")


Microsoft and the Office logo are trademarks or registered trademarks of Microsoft Corporation in the United States and/or other countries.
