Learn how to use Maps in PowerPoint.
Author: Geetesh Bajaj
Product/Version: PowerPoint
 Maps make excellent visuals and can add so much relevance to presentations that speak about anything to do with geography. You may want to:
In the rest of this article, we'll explore possibilities and implications of using maps in PowerPoint. It's important that you understand that we are discussing professional, cartographic maps here and not the other map type: route and location maps.
The biggest problem with using maps in a presentation comes from the fact that designers don't use good-quality maps. More often than not, such maps are sourced from within PowerPoint's own clip art collection. That's changed since new versions of PowerPoint no longer include the maps! Nor are such maps to be found as of today on Office Online.
Presentation designers are looking for high-quality maps that look different from the conventional or the ordinary. Yes, such maps are often very expensive but if you purchase one high-resolution world map and another high-resolution map of your country, that's going to be a long-term investment worth the cost.
We ended up sourcing maps from Matton, a worldwide provider of high-quality clip media. Our contact at Matton was Chris Ferrone, Managing Partner. Thank you, Chris.
You'll find links to more map resources here.
Choosing a map format is probably the most important decision you'll have to take — it's important that you take the right decision since maps don't come cheap. Normally, you'll have to choose between two format styles — vector and bitmap.
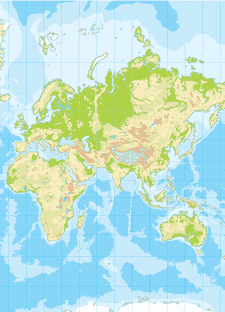
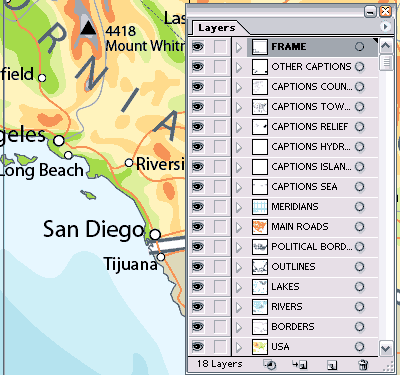
A vector format map normally comes in several styles including political and geographical. Political maps show all countries color-coded and geographical maps include bump maps based on the land and sea elevations. Most of the time, these maps include layer-wise distribution of content — thus you'll find several layers of captions and legends — and then some layers of elevation. You'll also find separate layers for country boundaries. These vector maps need to be in layer-compatible formats that are also print-friendly — most of the time this means that the maps are available in EPS (Encapsulated Postscript) or AI (Adobe Illustrator) format.
Unfortunately, PowerPoint cannot import both these formats natively — but that's probably a blessing in disguise because you really do not want to import such high-resolution maps in PowerPoint anyway — that's a sure-fire way to bloat up your presentation size and make it unmanageable!
Maps are also available in bitmap format — they are almost the same as the vector maps apart from the fact that they come in a bitmap format like PSD (Photoshop) that supports layers. If you have to choose between vector and bitmap maps, do choose the vector option since those maps can always be saved to a bitmap format. Going the other way from bitmap to vector is seldom that easy or even possible.

In the screenshot above, you can see how a typical professional map looks inside a layer-compatible application like Adobe Illustrator - there are separate layers for most geographical entities like captions, roads, lakes, elevation, etc.
Map Courtesy: Matton Royalty Free Vector & Bump Maps
We already mentioned that you should not insert such high-resolution maps in PowerPoint. There are two reasons for that:
You can open the vector format map files in applications such as:
Adobe Illustrator,
CorelDRAW,
Macromedia Freehand,
Microsoft Expression
and most other drawing or illustration software.
Some of these applications also allow you to choose which layers you want visible. Thereafter export it to a low resolution (72 dpi) bitmap format like PNG. If your intended use is within PowerPoint, PNG is the best format to use because PowerPoint internally converts all bitmap formats except JPEG to the PNG format while saving it as part of a presentation.
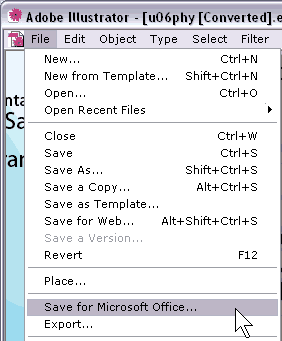
Also, newer versions of Adobe Illustrator (Illustrator CS) and CorelDRAW (CorelDRAW 12) have a Save For Microsoft Office option within the File menu - this option typically uses PNG as the export format.

In the screenshot above, you can see how you can export to a PowerPoint-friendly graphic format like PNG with just one menu option in Adobe Illustrator CS using the new Save for Microsoft Office command.
If you need to insert a vector map inside PowerPoint, save the map file to either the WMF or EMF formats from any of the applications listed above.
If you have sourced a bitmap format map file like PSD, repeat the same procedure and export to a low-resolution bitmap format. You'll be able to open PSD files in applications like:
Adobe Photoshop
Corel Paint Shop Pro
Inserting a map in PowerPoint is as simple as inserting any other graphic.
Choose Insert | Picture | From File… and navigate to wherever you have saved your file.
Within PowerPoint, you can do so much to make your map more interesting:
Maps can play a very significant role within a presentation since they represent a category of graphics known as intelligent visuals. Like diagrams and charts, maps show facts. Unlike diagrams and charts, maps can rarely be manipulated - thus your audience will certainly be more prone to trust the content presented through maps.
Presentations can be made more interesting by using maps. This assumes added significance nowadays because audiences are easily bored with seeing the same presentation styles and always want to see something presented in a different way.
You May Also Like: Present a PowerPoint Without Laughing? | Aircraft PowerPoint Templates


Microsoft and the Office logo are trademarks or registered trademarks of Microsoft Corporation in the United States and/or other countries.