Indezine Logo


Set Minimum and Maximum Values on Value Axis in PowerPoint 2013 for Windows

Set minimum and maximum values on value axis of charts in PowerPoint 2013 for Windows. Be careful though and possibly add a warning that the data may appear distorted.


Author:

Product/Version: PowerPoint 2013 for Windows

OS: Microsoft Windows 7 and higher


Learn PowerPoint

Explore guidelines about the smallest font size for PowerPoint Slides.


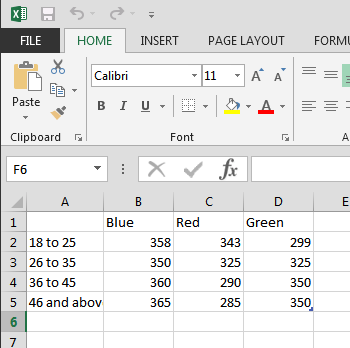
If your chart data values are not so much different from each other, the chart created using this data will not help your audience to differentiate the series representing those values. Our sample data, shown in Figure 1, below, explores how people of different age brackets choose their favorite colors. If you look closely at the data, you will realize that all values span between 285 and 365. So, it makes no sense to even discuss any value lower than 250 or above 370 for this data set.
What's your favorite color?
Figure 1: What's your favorite color?

Tip: To quickly see the data for any chart, right-click the chart, and from the contextual menu, select the Edit Data option.

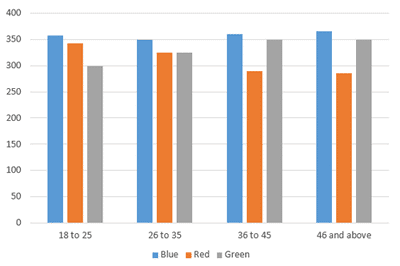
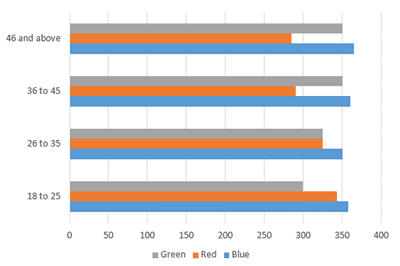
Yet, when you create sample column and bar charts from this data using PowerPoint's defaults, you'll end up with charts akin to what you see in Figure 2, below. The chart on the top shows columns that are very similar in their heights. There really is no contrast highlighting the findings of our data. It's the same story with the bar chart below where the bars look almost similar in length.
A Column chart and a Bar chart with columns and bars that are very similar

 A Column chart and a Bar chart with columns and bars that are very similar
Figure 2: A column chart and a bar chart with columns and bars that are very similar

The reason for lower contrast between values in these charts is that maximum and minimum values set for the value axis are calculated from a minimum value of zero. This actually makes the differences in the column height or bar widths so much less pronounced, and thus makes the chart much less effective as a visual medium.

The Value Axis

The value axis is the vertical axis on the left of a typical column chart, or the horizontal axis at the bottom for a Bar chart (see Figure 2, above). Learn more about chart axes.

Fortunately, you can easily choose your own maximum and minimum values

The Ethics of Distortion

Yes, we did show you how you can change maximum and minimum values on the value axis. This makes the difference between the various columns more pronounced. But chart purists differ, and in many ways they are right because although your comparisons are pronounced, they are also not the truth—at least not the whole truth. Many people in your audience may not see that your values do not begin from zero, and some charts created this way may forego the values within the axis altogether. So what should you do? The answer is to strike a balance. If you do alter the values to no longer start at zero, make that very apparent to your audience.

Make sure you add a note to that effect on your slide, and even draw the attention of your audience to this fact.

In the following steps, we are using our column chart in PowerPoint 2013 for Windows as an example. But, the same techniques will work for bar charts too.

Follow these steps to learn more in PowerPoint 2013 for Windows:

  1. First of all, take a look at your chart data and note down the maximum and minimum values. Our chart data that you saw in Figure 1 earlier on this page has a minimum value of 285, and a maximum value of 365. Now decide the maximum and minimum values to be assigned for your value axis. Considering our sample chart data, we decided to set our minimum value to be 250 (less than 285) and the maximum value to be 370 (more than 365).
  2. Now, select the value axis of the chart. Carefully, right-click to access the contextual menu as shown in Figure 3, below. If you do not get the Format Axis option in the contextual menu, you may have right-clicked on another chart element. Make sure you then deselect anything in the chart, and then right-click on the value axis again.
  3. Format Axis option selected for the Value Axis
    Figure 3: Format Axis option selected for the value axis
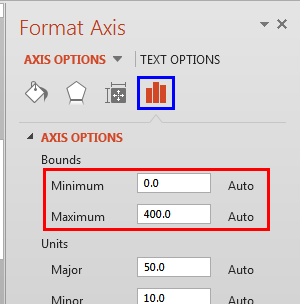
  4. Doing so opens the Format Axis Task Pane, as shown in Figure 4, below. Make sure that the Axis Options button is selected as shown highlighted in blue within Figure 4.
  5.  Format Axis Task Pane
    Figure 4: Format Axis Task Pane
  6. With the Axis Options button selected within the Format Axis Task Pane, locate the Minimum and Maximum options, highlighted in red within Figure 4, above. As you can see, the Minimum and Maximum options are set to Auto by default, which is indicated by the text Auto.
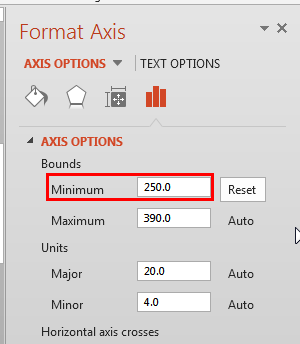
  7. Click within the box provided with the Minimum option, and then type a new minimum value, as shown highlighted in red within Figure 5, below. For our sample chart, the Minimum value was changed to 250. This may change the Maximum value since it is still set to Auto option, as shown in Figure 5. The Reset button that shows up next to the Minimum option can be clicked upon if you want to get back the automatic value.
  8.  Minimum Vertical axis value changed
    Figure 5: Minimum value changed in the axis
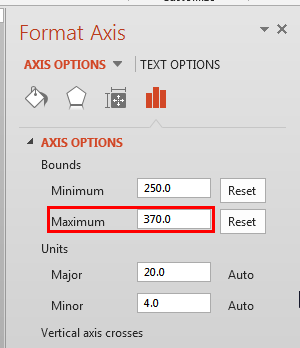
  9. Similarly, click within the box provided with the Maximum option, and then type a new maximum value, as shown highlighted in red within Figure 6, below. For our chart example, the Maximum value was changed to 370. The Reset button that shows up next to the Maximum option can be clicked upon if you want to get back the automatic value.
  10.  Maximum Vertical axis value changed
    Figure 6: Maximum value changed in the axis
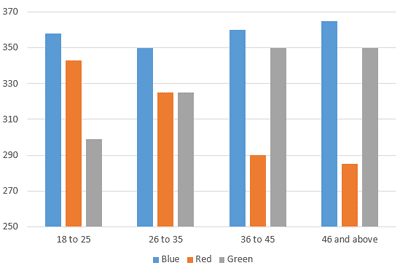
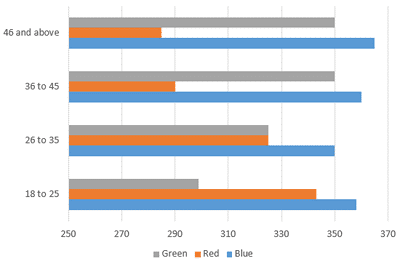
  11. Now you can see that the maximum and minimum values on the value axis have changed to new values. If you compare the charts in Figure 7 with the charts in Figure 2 shown earlier on this page, you will find that the charts within Figure 7 provide a more pronounced contrast for the data.
  12. Charts with changed Maximum and Minimum values on Vertical axis
  13. Charts with changed Maximum and Minimum values on Vertical axis
    Figure 7: Charts with changed maximum and minimum values on the value axis
  14. Save your presentation often.

See Also:

10 08 03 - Chart Axes: Set Minimum and Maximum Values on Value Axis (Glossary Page)

Set Minimum and Maximum Values on Value Axis in PowerPoint 2011 for Mac
Set Minimum and Maximum Values on Value Axis in PowerPoint 2010 for Windows

You May Also Like: 4 Ideas to Help You Find The Right Story For Your Next Presentation | Everyday PowerPoint Templates


Popular Posts

Create Animated GIFs from PowerPoint Slides
Explore ways to create animated GIFs from PowerPoint slides.

PowerPoint Tutorials
These PowerPoint tutorials have many screen shots that show you exactly what you see in your computer!

Use Safe Fonts Available on All Systems in PowerPoint
Learn about using safe fonts in PowerPoint.

10 Tips for Pecha Kucha
Read 10 amazing Pecha Kucha tips that will help you create and deliver a better Pecha Kucha presentation.


Jigsaw Graphics for PowerPoint

Here are 10 jigsaw graphics containing different shapes. These graphics are available in both black and white and are contained within separate sample presentations that you download. Additionally, these jigsaw graphics are vector shapes, so you can easily edit them within your Microsoft Office program by changing fills, lines, and effects or even applying Shape Styles.

Download and use these Jigsaw Graphics in your slides for just $4.99+


Microsoft and the Office logo are trademarks or registered trademarks of Microsoft Corporation in the United States and/or other countries.

Home | PowerPoint | Photoshop | PowerPoint Templates | PowerPoint Tutorials | Blog | Notes | Ezine | Media Kit | Feedback | Site Map | About Us | Contact Us

Link to Us | Privacy | Testimonials

PowerPoint Backgrounds | Christian PowerPoint Backgrounds | Business PowerPoint Presentation Templates

Plagiarism will be detected by Copyscape

©2000-2023, . All rights reserved.