There are a number of ways to create a table in PowerPoint, from inserting them with a specified number of rows and columns, to something as intuitive as drawing your own table. Most of the tables you create using either of these two methods will show borders between individual cells. These borders make the segregation between cells obvious. Yet, at times you may not want to see the border at all—probably for design reasons. Before proceeding further, what we need to understand is that not seeing the border is not the same as getting rid of the border altogether—the latter option of removing borders takes place when you merge cells, or even when you erase some borders.
What if you just want to hinder the visibility of the border, as in a border that exists but is not visible? The Border options allow you to make some of table borders visible or invisible for the entire table, or for a bunch of contiguous table cells that are selected. Follow these steps to learn more:
- Open your presentation in PowerPoint 2013 for Windows and navigate to the slide where your table is located and select it—select the entire table, or a few contiguous cells as required. Then access the Table Tools Design contextual tab (highlighted in red within Figure 1) of the Ribbon. Within this tab, locate the Borders button and click the down-arrow beside this button (highlighted in blue within Figure 1).
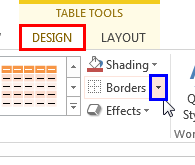
Figure 1: Down-arrow beside the Borders button - This brings up the Borders drop-down gallery, as shown in Figure 2.
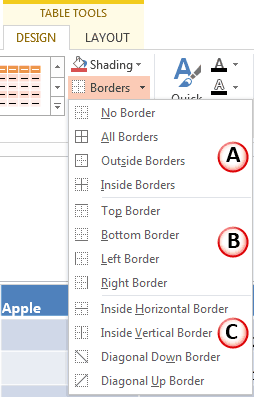
Figure 2: Borders drop-down gallery - When you look at the Borders drop-down gallery shown in Figure 2 above, you will notice that the options are arranged in three groups, where each group specifies a particular arrangement of Table Borders. Each of the options within these three groups is essentially a toggle button (except the No Border option). So, clicking it once turns on the Table Borders, and clicking it again will turn them off. Let us explore these options within each group, as they appear in Figure 2, above:
- The options within the first group of the Borders drop-down gallery are:
- No Borders: Turns off all of the Table Borders from the selection.
- All Borders: This option turns on all borders in a table, except Diagonal borders.
- Outside Borders: As the name suggests, this option turns on all four outside borders of the selection.
- Inside Borders: Turns on only the horizontal and vertical borders within the selection. This option will be available only when multiple cells are selected, or the entire table is selected.
- Figure 3 shows variations of a table applied with No Borders, All Borders, Outside Borders, and Inside Borders options.
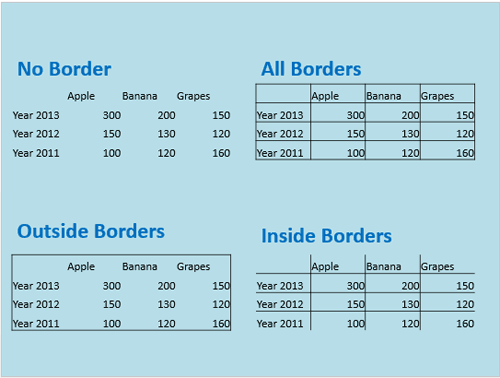
Figure 3: No Borders, All Borders, Outside Borders, and Inside Borders options applied to the same table
- The options within the second group of the Borders drop-down gallery are:
- Top Border: Turns on/off the top border for the selection.
- Bottom Border: Turns on/off the bottom border for the selection.
- Left Border: Turns on/off the border towards left-side for the selection.
- Right Border: Turns on/off the border towards right-side for the selection.
- Figure 4 shows variations of a table applied with Top Border, Bottom Border, Left Border, and Right Border options.
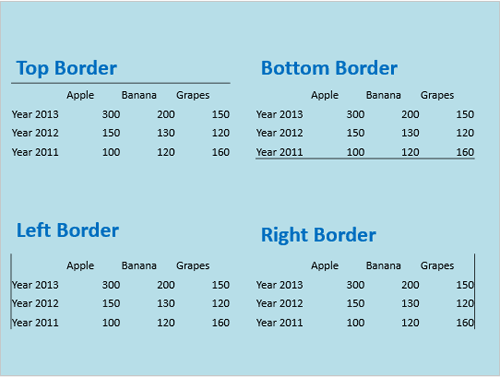
Figure 4: Top Border, Bottom Border, Left Border, and Right Border options applied on the same table
- The options within the last group of Borders drop-down gallery are:
- Inside Horizontal Border: Turns on only the horizontal borders within the selection. This option will be available only when multiple cells are selected, or the entire table is selected.
- Inside Vertical Border: Turns on only the vertical borders within the selection. This option will be available only when multiple cells are selected, or the entire table is selected.
- Diagonal Down Border: Turns on the diagonal line connecting top-left and bottom-right corners of each table cell, within the selection.
- Diagonal Up Border: Turns on the diagonal line connecting top-right and bottom-left corners of each table cell, within the selection.
- Figure 5 shows variations of a table applied with Inside Horizontal Border, Inside Vertical Border, Diagonal Down Border, and Diagonal Up Border options.
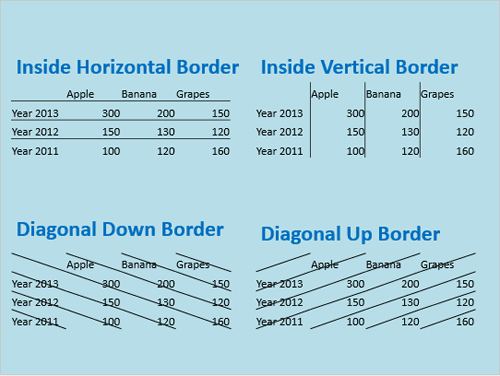
Figure 5: Inside Horizontal Border, Inside Vertical Border, Diagonal Down Border, and Diagonal Up Border options
- Select the Borders options you require.
- Save your presentation often.


